Understanding The Basics of Trend line
The Basics of Trend line
As a forex or crypto trader, you can increase your chances of making profit by performing a successful transaction which is more important for you to understand the direction of the market whether it's moving in am uptrend or downtrend. Having said so, trend lines are line that are connecting a series of prices to give traders a clearer image, direction of an asset.
When the asset you are trading in moving in an uptrend is indication that the demand of the assets is growing.i.e buyers are busy buying the asset, (buying pressure is greater than selling pressure). In the case of a downtrend, the asset will be moving downward which means the excess supply for the asset, is experiencing selling pressure.i.e traders are selling the asset instead of buying. As an experienced trader, whenever there is a downtrend moves you will see a black dotted line, which means you should avoid a long position since what you would gain wouldn't be enough.
Support and Resistance
When it comes to trading, trend lines are a very important tool that me help show you the general direction of the asset you are trading on, although, as a trader, you can also use trend lines, to identify the levels of support and resistance. This means that trend lines can help us to determine the points on a chart beyond which the price of the traded asset will struggle to move. As a crypto or forex trader, such information can be of help if you are looking for a strategic entry position, or you want to maximize risk and thereby identify where you should place your stop loss and take profit orders.
Now as a technical indicator you should always pay close attention the moment you have notices that the price of the asset you are trading have approaches a trend lines since it is the levels where significant role in determining both short and long direction of the asset. As the price of the asset reaches the level of key support and resistance, it is obvious that either the support or the resistance level will bounce off the trend line and continue moving in the prior trend direction or move through the trend line, indicating a weaken trend or a trend reversal.
Types of Trend line
We basically have two types of Trend lines, which are:
Ascending trend line
Descending trend line
Ascending trend line:
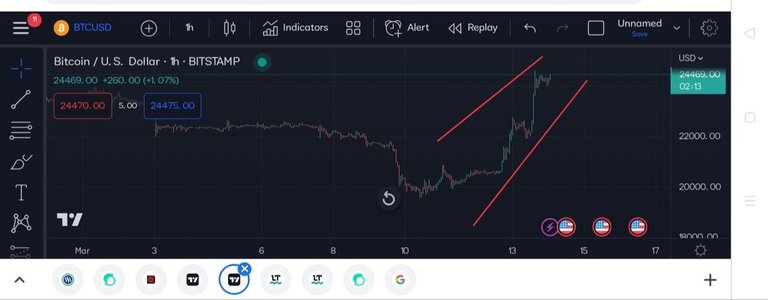
This is the trend line that move in an uptrend and formed by connecting the lows at the time when the most recent low price is than that of the prior low price. At this point, what you will see is the levels of support moving in an uptrend line extending towards the future.
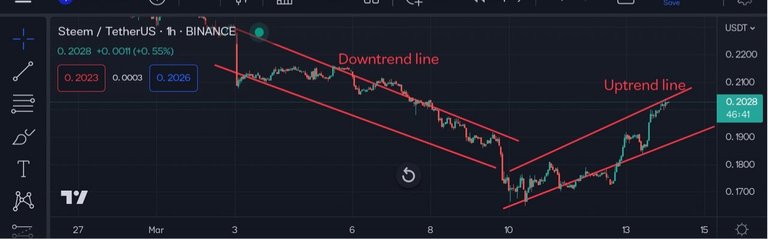
Descending Trend line:
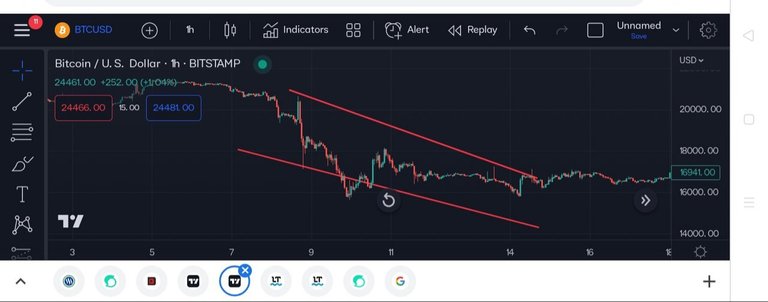
This is the trend line that move in a downtrend, i.e. in an opposite direction of the ascending trend line. For a descending Trend line, you will get to see the most recent high being lower than that of the prior high. At this point, the fallen line is the resistance level moving in a downtrend extending towards the future.
Posted Using LeoFinance Beta