BITCOIN: Bullish Scenario - Cup & Handle
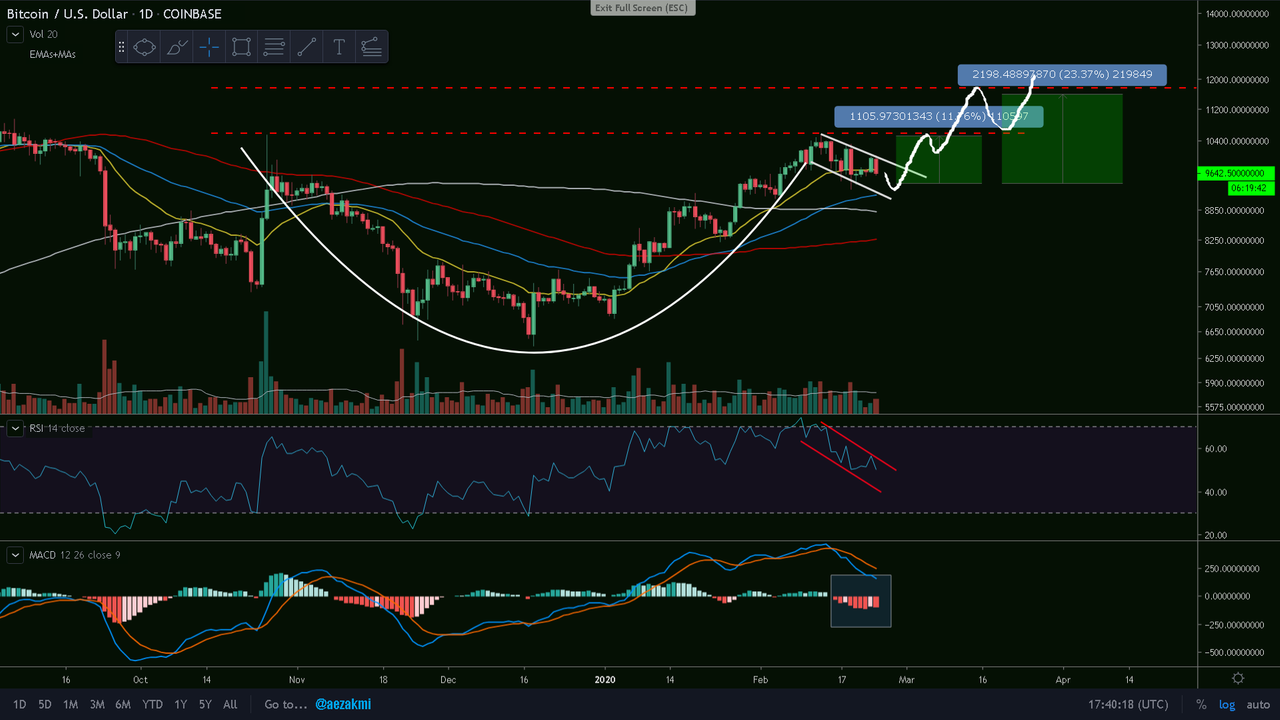
BTC/USD Daily Chart
This bullish scenario includes Bitcoin retesting the 10500$ resistance, breaking it, than going towards the 11800$ region and perhaps returning to 10500$, which will act as support this time.
Descending channel on the RSI too and decreasing bearish MACD - Histogram.
Keep in mind that we could first revisit the 55 day EMA (blue), which aligns with the lower line of the handle - currently at 9200$.
The white drawing is just for orientation.
Ctrl + Click here to enlarge the image in a new tab (steemitimages)


Thanks for reading and safe trading!✌
If you find this post useful, please:

0
0
0.000
Update 1:
Ctrl + Click here to enlarge the image in a new tab (steemitimages)
Update 2:
Ctrl + Click here to enlarge the image in a new tab (steemitimages)