Bitcoin difficulty adjustment
I just found this peach of a chart
It shows the bitcoin difficulty adjustments over the past 7 years.
A Red dot indicates a positive adjustment while a Blue one indicates a negative one.
And that is all overlayed on a price chart.
Look at what happens when we see a Blue dot followed by a Red dot:
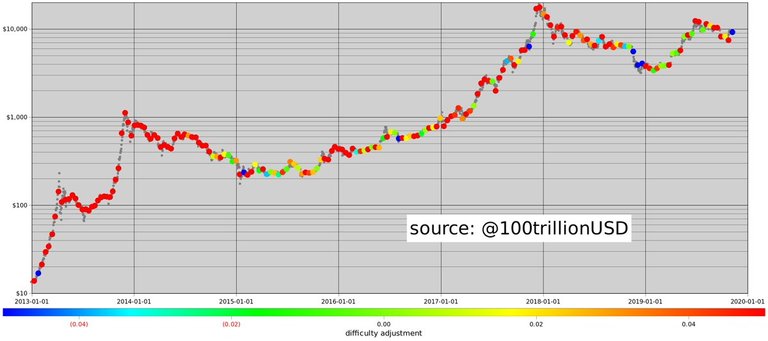
(Source: https://twitter.com/100trillionUSD/status/1194219172861030400)
The next difficulty adjustment is projected to be positive, so Red.
Which means we have a Blue then Red setup.
That has been good news in the past.
0
0
0.000
0 comments