Ethereum: Targeting Some Key Levels
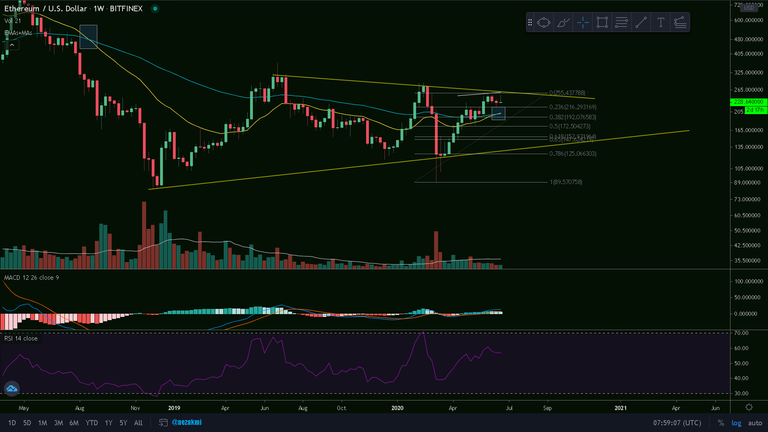
ETH/USD Weekly Chart
Looking at the weekly chart, we can see that Ethereum is once again near the one year long descending trend line. Furthermore, the resistance is amplified by the (new!) 200 weekly MA, currently at $259, so I assume we'll need a lot of bullish momentum to break this level. If Bitcoin does the >$10000 move, ETH would probably follow and we could see a candle wick outside of this triangle pattern, but as long as we don't close above the upper trend line, we could end up in a bear trap. A bullish sign however, is the 21-55 EMA's cross (yellow-blue), considering we've been under for almost two years now. Despite this cross, we have the trading volume decreasing, as well as the MACD Histogram, which aren't quite bullish marks.
Ctrl + Click here to enlarge the image in a new tab (steemitimages)
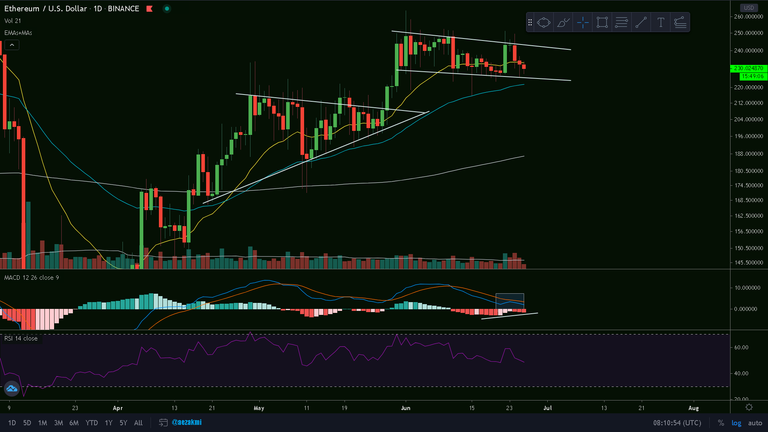
ETH/USD Daily Chart
On the daily, we have this flag pattern forming and we're testing the lower support line again. There's also the 55 day EMA (blue) helping the bulls, but if'll close beneath the lower line, the bears could get in control and $215 would be very attractive. We have a MACD rejection at the signal line, but the Histogram is increasing, indicating the bulls are gaining momentum. The RSI also reached a level (46) from where it bounced in the last two months. Therefore, I consider that another attempt to break the upper flag resistance (now $240-$242) is not excluded.
Ctrl + Click here to enlarge the image in a new tab (steemitimages)


Thanks for reading and safe trading!✌
If you find this post useful, please:
