ICON: Leading The Way
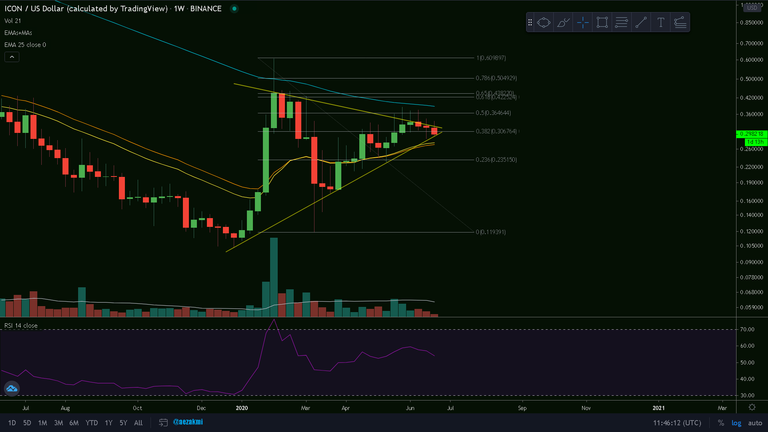
ICX/USD Weekly Chart
Icon seems to be somehow leading the way: it has reached the end of the triangle before BTC or ETH. Still one day left before we close the weekly candle and start the next one, which will probably indicate the direction of the trend. The trading volume is low and if we'll break to the downside, we will most likely revisit the 21&25 EMA's support level (yellow-orange) at $0.276, or even worse, towards the 0.236 Fibonacci retracement.
The next week could be quite interesting: we could see the bulls and bears battle at the peak of the triangle, with a spike in volume and having the candle wick reaching the 21 EMA, but still closing above the 0.382 Fib. retracement. Curious about which side will win the weekly candle.
Ctrl + Click here to enlarge the image in a new tab (steemitimages)
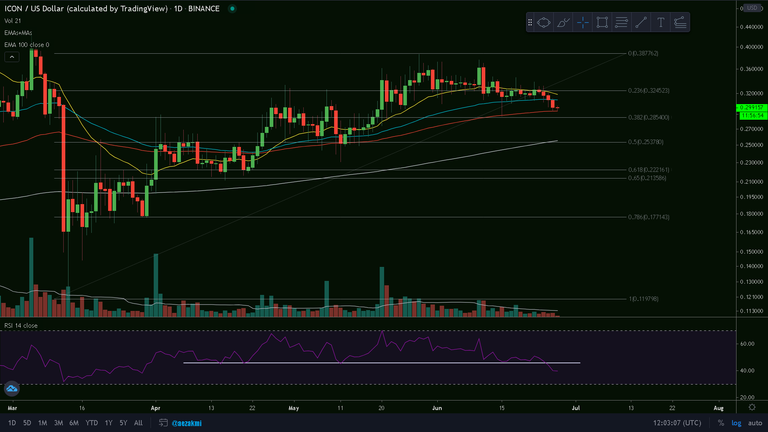
ICX/USD Daily Chart
Daily doesn't look too good either: we lost the 55 EMA (blue) and the 3-month RSI support (45 level) and are currently fighting at the 100 EMA (red), but with low volumes. If things worsen, we could get next week a touchdown at the 200 day MA (grey), currently $0.256.
Ctrl + Click here to enlarge the image in a new tab (steemitimages)


Thanks for reading and safe trading!✌
If you find this post useful, please:
