Quick trade on WAVES/USDT: Double Bullish Pattern
I don't know which pattern is more bullish, the W pattern or the Inverted Head and Shoulders one which WAVES is showing on the 4-hour chart.
According to the W-BOTTOM pattern, we can identify both bottoms, being the second slightly lower than the first which used to be the ideal setup.
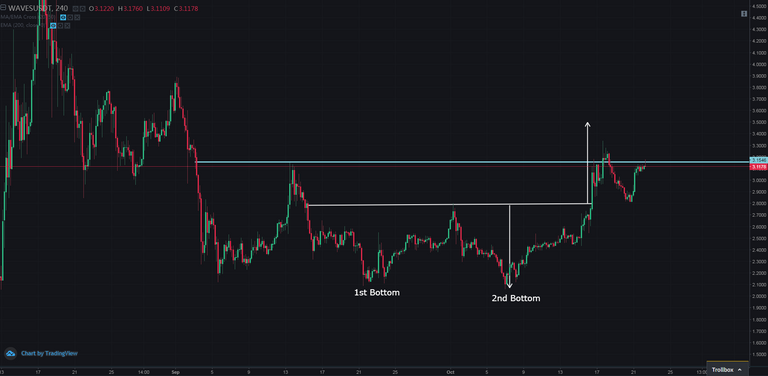
Also, we have seen, the price action has broken the "Neckline" of the W-Pattern getting, for the moment 75% of the projected target which is 3.492 USD.
Actually, as soon as BTC started to pump up hardly the past 2 days, we could also see that WAVES was also sold for BTC, as the majority of altcoins but, in this case, what we get is a nice formation of another Bullish pattern, the Inverted Head and Shoulders.
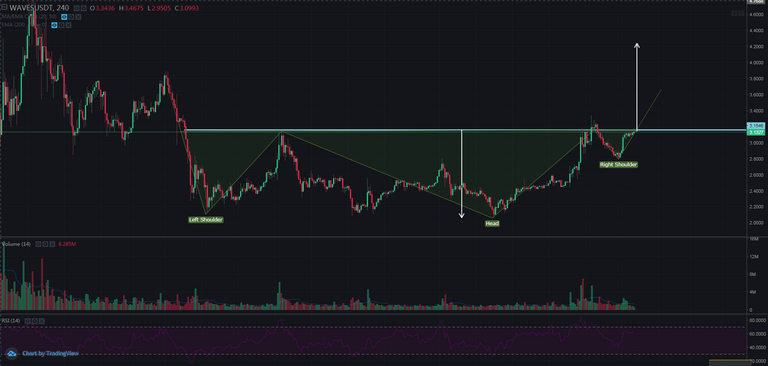
It is not the most typical "shape" since the Right Shoulder rebounded on an upper bottom in comparison with the Left one but the price is really "knocking" the resistance in blue a few times and I think there is a high likelihood of breakage now.
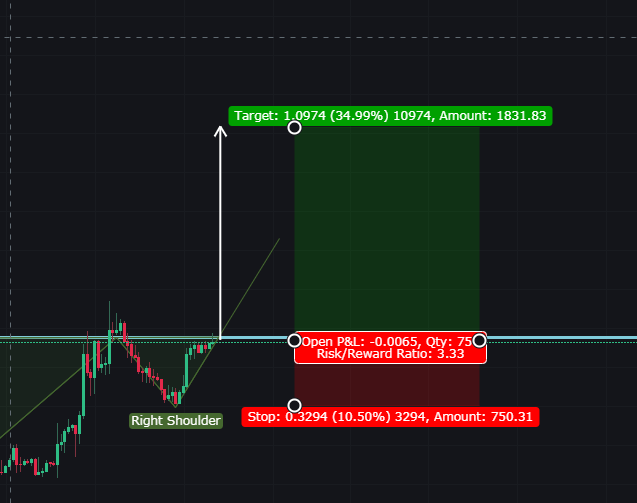
The projected target for the iHS is 4.24 USD (= +35% of the current price).
As usual a proper stop loss is always necessary.
I'm sharing only my quick trading Ideas here, not financial advice at all ;-)
*Disclaimer: This is just my personal point of view, please, do your own assessment and act consequently. Neither this post nor myself is responsible of any of your profit/losses obtained as a result of this information.


Good trend spotted and I like the explanations as I can easily understand them. And the market now supports BUY and SELL orders, let's see it come to fruition.
Posted Using LeoFinance Beta
Glad you like it.
I have to say I had closed the position... there is so much uncertainty.
@tipu curate
Upvoted 👌 (Mana: 10/20) Liquid rewards.