Bitcoin Analysis for 31/03/2021

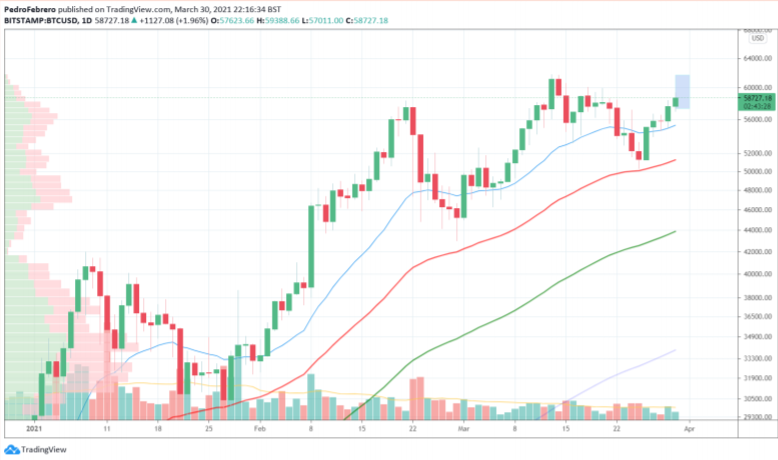
Bitcoin's price continues to move up, and it has rallied almost 2% in the past 24 hours. BTC/USD has risen significantly during the past week, nearly 9%, and is now attempting to break another critical resistance level, close to $60,000. At the time of this writing, bitcoin's price is trading close to $58,800 according to CoinGecko.
Not only that, but buying volume is slowly increasing, a sign that a recent influx of new buyers has joined the bitcoin space.
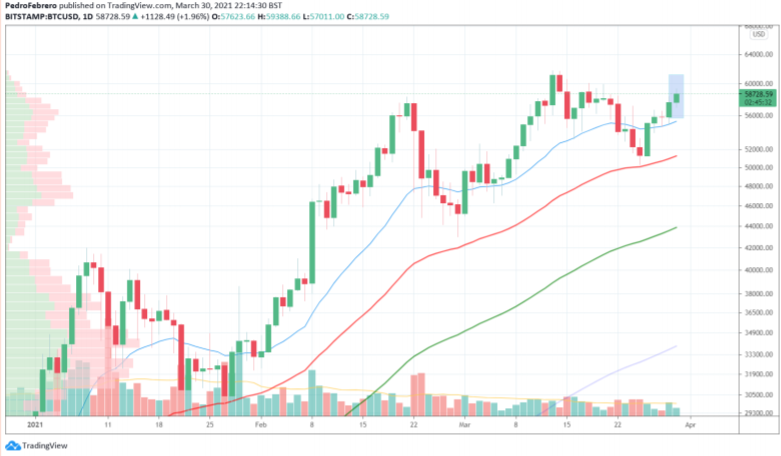
Bitcoin traded within the predicted price range (blue), and, just like we wrote Monday, it should break its prior all-time high soon. We think before the week comes to an end.
In terms of news, Coindesk's Kevin Reynolds penned an excellent article detailing why merchant adoption will be on the rise during 2021. The reporter wrote that
"PayPal, which last year added the ability to buy, hold and sell cryptocurrency, is pushing it as a payment method across the 29 million or so online merchants connected to the fintech giant."
Therefore, the more merchants that hear of bitcoin and deal with the cryptocurrency, the higher the chances some will choose to accept it as a means of payment and storing value instead of fiat currency.
To conclude, we believe bitcoin's price will soon attain a brand-new all-time high, and we remain bullish on BTC/USD as long as:
- BTC/USD remains above its 20-day MMA (red), 50-day MMA (green), and 200-day MMA
(blue). - BTC/USD doesn't drop below $55,000.
- BTC/USD daily volume goes above its 21-day MMA soon
Traders Thoughts
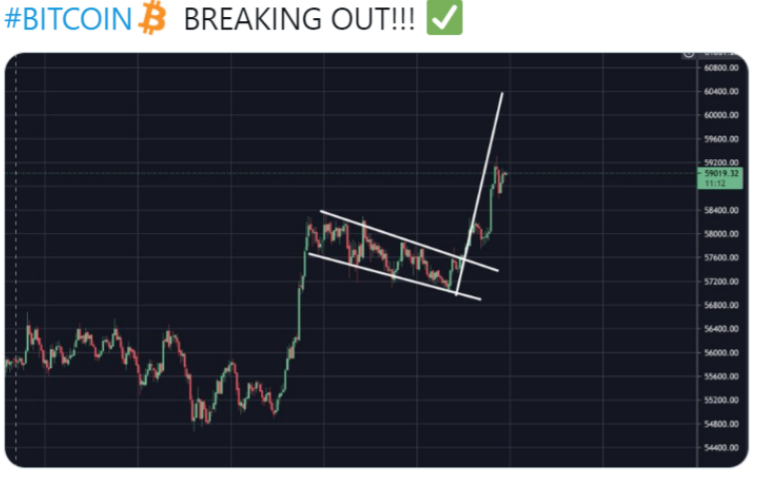
Today’s first tweet comes from The Moon (TheMoonCarl), a bitcoin investor and trader with more than 180,000 followers on Twitter.
In his post, The Moon shared a chart of bitcoin’s price. He also added a descending channel known as a bull flag, a pattern that typically forms during uptrends. According to Investopedia,
“The breakout from a flag often results in a powerful move higher, measuring the length of the prior flag pole.”
If the Moon’s technical analysis plays out, it means bitcoin’s price could make a swift move above $60,000, sometime in the next few days. At the moment of this writing, BTC/USD is holding well above $59,000, which points in that direction.
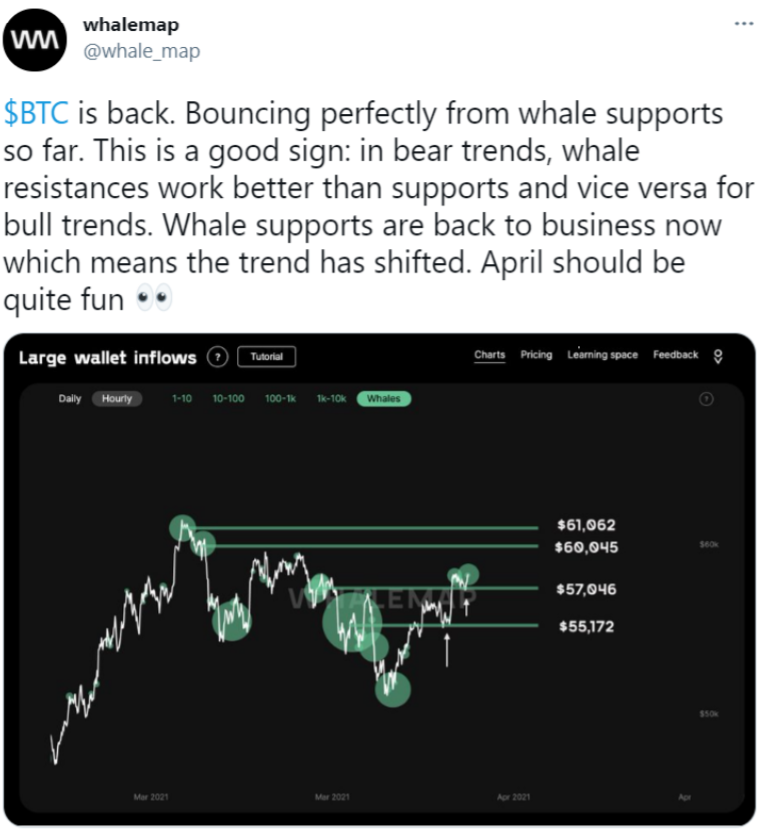
The following post comes from Whalemap, an on-chain analytics platform.
In its post, Whalemap shared the "Large wallet inflows" chart that shows when whales made large bitcoin purchases - between 1 and 10,000 bitcoin. Whalemap also wrote,
"$BTC is back. Bouncing perfectly from whale supports so far."
As you can see from the chart's horizontal lines, bitcoin's price has found strong support above $55,172 and $57,046. The following resistance levels bitcoin needs to conquer and turn into support are at $60,045 and $61,062.
We think that if bitcoin moves above its prior high, it will most likely continue to move up until it reaches $68,000 - $70,000.
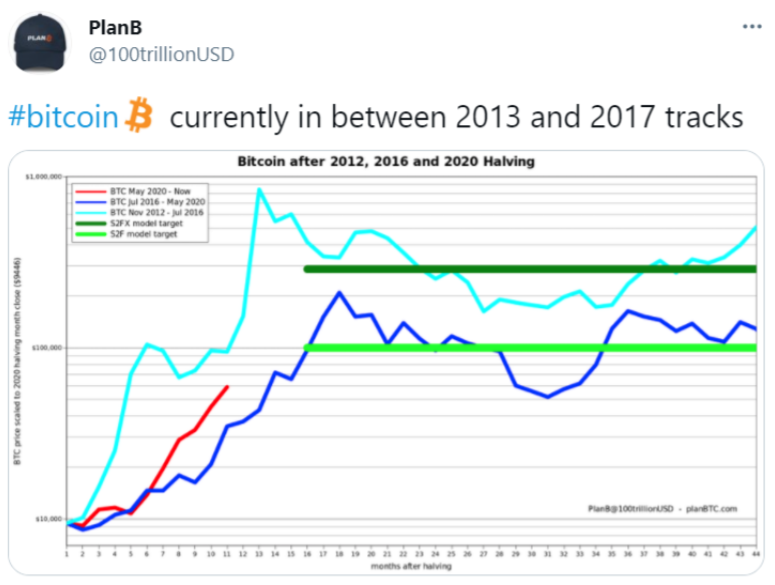
The following tweet comes from PlanB (@100trillionUSD), a Dutch institutional investor with a legal and quantitative finance background.
PlanB shared the
“Bitcoin after 2012, 2016 and 2020 Halving” that shows bitcoin’s price evolution after each of the halving events, that according to Investopedia, “is when the reward for mining Bitcoin transactions is cut in half.”
The trader also wrote that “#bitcoin currently in between 2013 and 2017 tracks”, pointing out that the current bitcoin’s price trajectory (red line) is falling between 2013 (light-blue) and 2017 (dark-blue). If the trend continues, bitcoin could reach a top close to $300,000, according to PlanB’s chart.
Oppositely, when bitcoin’s price drops, it wouldn’t go much below $100,000 - in case bitcoin continues to follow the current trend.
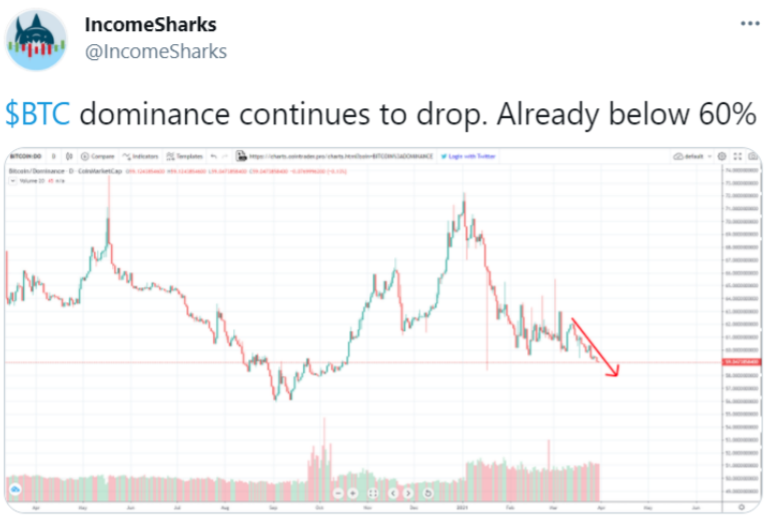
The last post of the day comes from IncomeSharks, a crypto education and market analysis Twitter handle.
In its post, IncomeSharks share the “Bitcoin Dominance (BTC.D)” chart. Additionally, they added an arrow pointing downwards to underline the most recent trajectory of BTC.D.
Essentially, as IncomeSharks wrote,
“$BTC dominance continues to drop. Already below 60%.”
What could this mean? We think that bitcoin gains are being diversified into altcoins. This is why the entire cryptocurrency market has been growing as of late, not only bitcoin.
We think that until the bull-run comes to an end, bitcoin’s dominance will continue to fall. Most likely, it will go towards 30%, just like in late 2017.
This is a big reason why we’re so bullish on altcoins as well.
Bitcoin Price Prediction
At the time of this writing, bitcoin's price is trading close to $58,800, according to CoinGecko. In the past seven days, BTC/USD has been on an uptrend, growing north of 7.5%, and we think it may as well continue during the upcoming month of April. Hence, a brand-new record price should materialize soon, perhaps by Friday.
Most analysts are pretty bullish on bitcoin and the entire cryptocurrency market and expect bitcoin's price to appreciate sometime during the next few weeks. Adding to that, most expect bitcoin to reach a target above $100,000 at the end of the bull cycle. The reason is the growing number of whales buying bitcoin and not selling and institutions like PayPal and Tesla joining the bitcoin space.
Therefore, how do we think the price will trade today? As shown in the above chart, we believe that bitcoin could top close to $62,000 in the next few days, as long as buyers return to the bitcoin space.
On the other hand, we don't expect the cryptocurrency to drop much below, above the 21-day SMA. If it fails to hold this level, then we think a drop toward $57,00 could play out; however, this is highly unlikely.
To finalize, the VPVR shows a high number of buy orders between $46,500 and $50,000. It also indicates that there are almost no sellers left above $62,000.
Posted Using LeoFinance Beta