Documented Trade #3 | Zilliqa

The trade I took today is on Zilliqa vs Bitcoin with an eye to increase the Bitcoin within the next 30 days. It is based on basic support/resistance levels inside a trading channel.
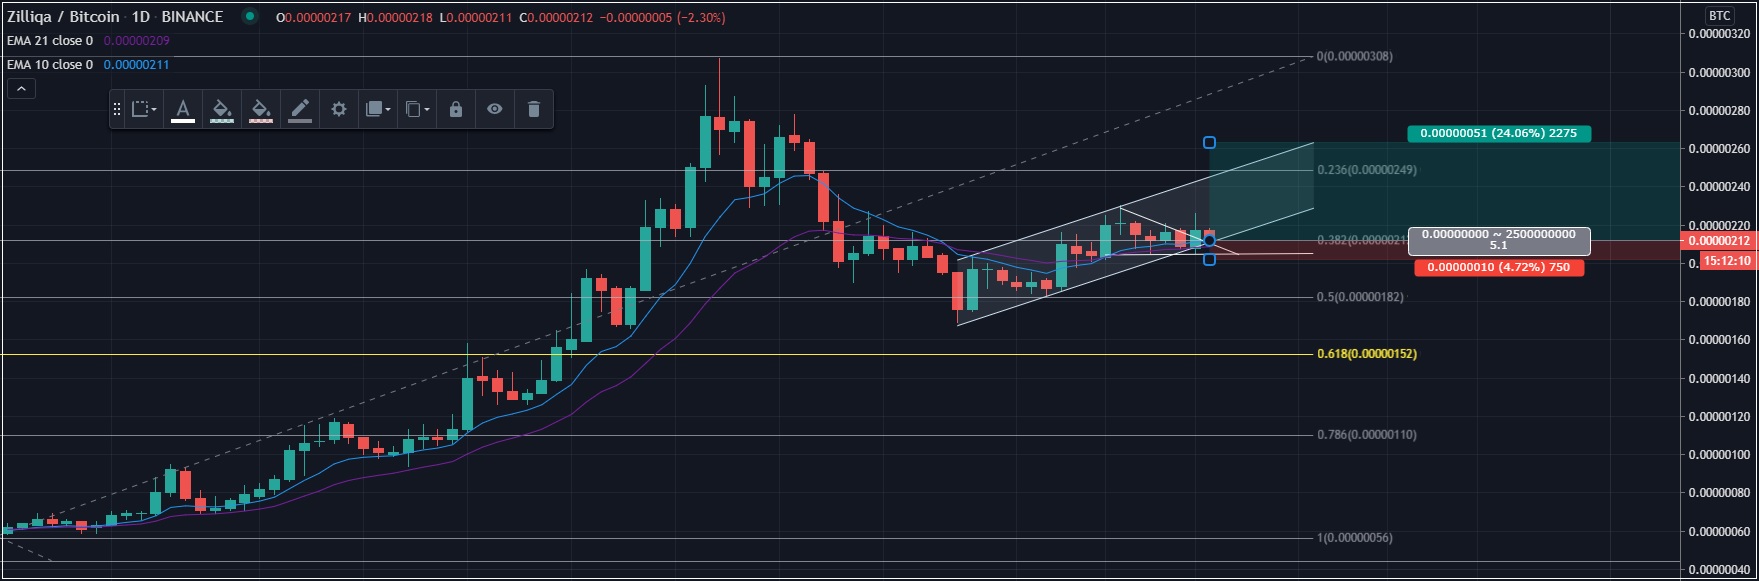
Looking at the daily chart, there has been a major move up followed by a correction that shows signs of having bottomed out. The price currently seems to be finding support on the 10-day moving average along with the 0.382 Fibonacci Retracement and the bottom of an upwards moving parallel trading channel. The 10-day moving average also is above the 21-day moving average which generally is a bullish indication and the 21-day moving average can act as secondary support in case the price breaks down a bit.
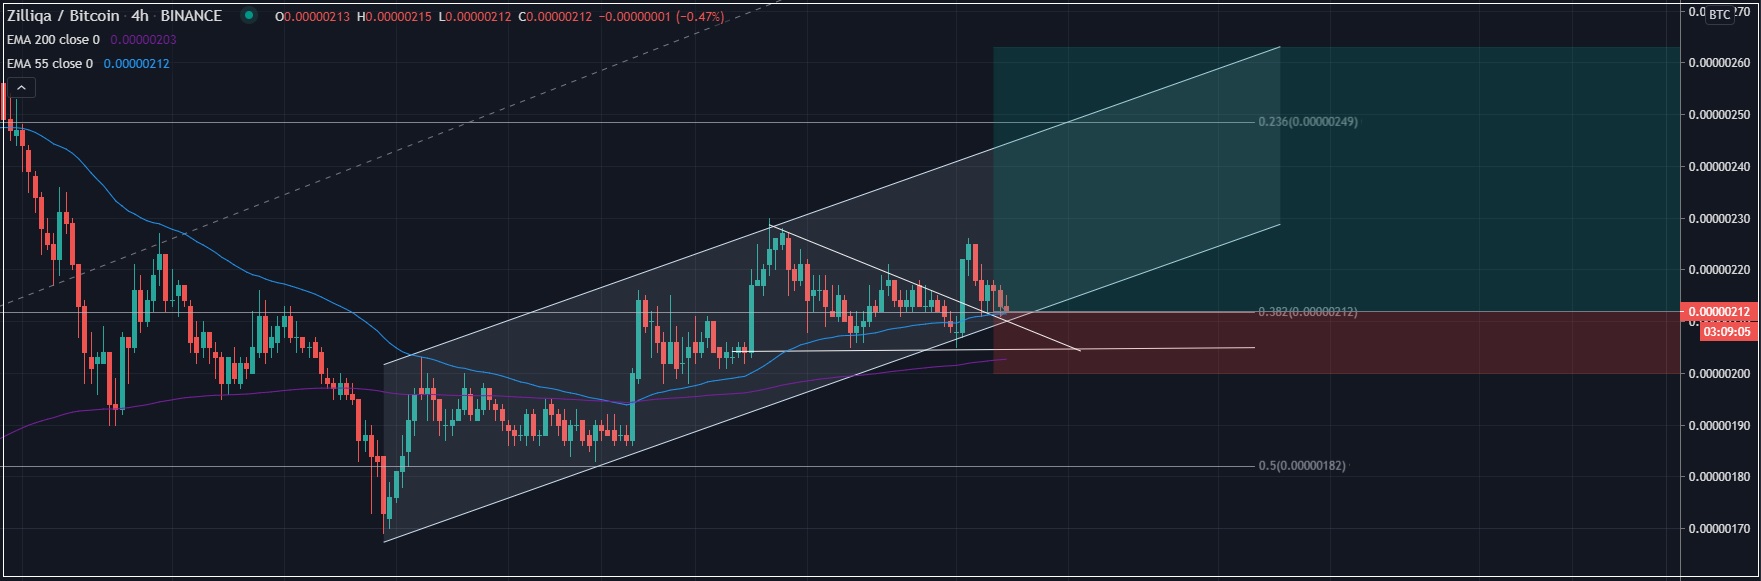
When taking a closer look at the 4-hour chart, it can be seen that the price in clearly in an upward parallel trading channel now hitting the bottom of it. The price of Zilliqa was also in a descending triangle pattern which broke up. There was a correction down and the previous resistance now seems to be acting as support.
Buy Price: 0.00000212 BTC
Stop Loss: 0.00000197 BTC
Sell Price: 0.00000248BTC-0.00000264 BTC
Time Window 1-10 days
| Trade | Status |
|---|---|
| Documented Trade #1 Chainlink | Complete +20.9% |
| Documented Trade #2 Bitcoin | Complete +0% |
| Documented Trade #3 Zilliqa | Soon |
I will also continue to make a summary of everything I'm learning about Technical Analysis in easy to understand bite-sized pieces
Technical Analysis Lessons
Technical Analysis #01 | Basics
Technical Analysis #02 | Trends
Technical Analysis #03 | Bearish Patterns
Technical Analysis #04 | Bullish Patterns
Technical Analysis #05 | Symmetrical triangles
Technical Analysis #06 | Volume Indicator
Technical Analysis #07 | Moving Averages
Technical Analysis #08 | MACD
Technical Analysis #09 | RSI
Technical Analysis #10 | Fibonacci Retracements
Technical Analysis #11 | Candlestick Patterns
Free Software I use for Charts
Tradingview
Free Software I use for Trading
Binance
 |
 |
Posted Using LeoFinance
Interesting