Learning Technical Analysis #10 | Fibonacci Retracements
Previous Technical Analysis Lessons
Technical Analysis #1 | Basics
Technical Analysis #2 | Trends
Technical Analysis #3 | Bearish Patterns
Technical Analysis #4 | Bullish Patterns
Technical Analysis #5 | Symmetrical Triangles
Technical Analysis #6 | Volume Indicator
Technical Analysis #7 | Moving Averages
Technical Analysis #8 | MACD
Technical Analysis #9 | RSI
#10 Fibonacci Retracements
The Fibonacci series of numbers are found all over in nature (Wikipedia) and also tend to show up in the world of investment as key ratios for support & resistance. The mail likely reasons is that so many traders are looking at is which makes it somewhat of a self-fulfilling prophecy.
Fibonacci Retracement Numbers

You can find the tool to do a Fibonacci retracement on the left side in Tradingview under the pitchforks drawing tools. You can customize the colors and numbers to your own liking. The best is to play around with it to find what suits you best.
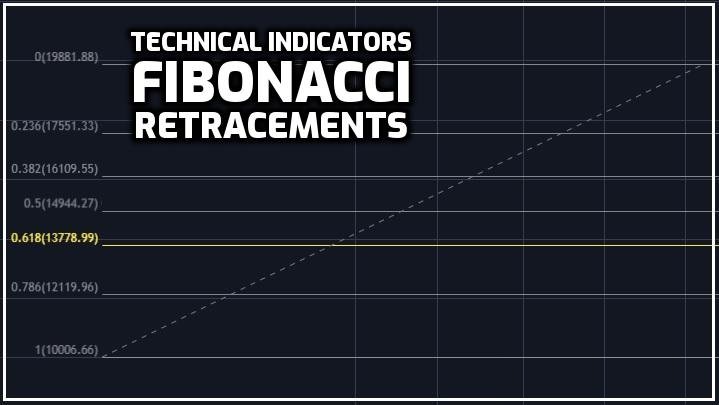
The numbers are 23.6% | 38.2% | 50% | 61.8% | 78.6%
The 50% is not a Fibonacci number but it's in there as a pullback often finds support dropping 50% of how much it went up in the first place.
The 61.8% is often talked about as the Golden Pocket and can be seen as the most important one.
Measuring The Fibonacci Lines
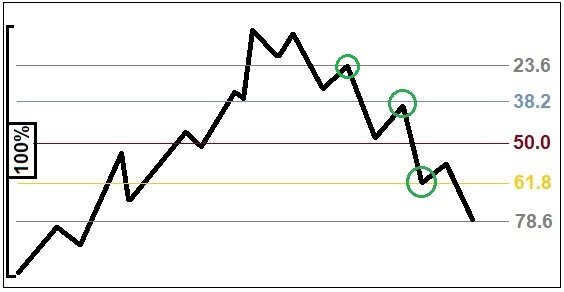
Basically you measure the bottom to the top from a swing move (or the other way around) which counts as 100% and the Fibonacci numbers are projected on there as lines that can act as support or resistance.
Example
When looking at the long term EOS/BTC chart you can do a Fibonacci Retrace measuring the entire bull market move up from the bottom to what ended up being the top. On the way down it can clearly be seen how the Fibonacci lines often acted as support or resistance.

These retracements can be used on both the long or the shorter timeframe. They have to be taken with a grain of salt though as there are so many variations that can be drawn that you will always be able to find them landing exactly where you want them to. Similar to the other technical indicators, this should be used just on top of analyzing the price, trend lines, and bullish or bearish patterns first.
Future Articles in this series
Publish0x | Costanza Technical Analysis
Free Software I use for Charts Tradingview | The Platform I use for Trading Binance |
|---|
|
|
|
|


Posted Using LeoFinance
@tipu curate
Upvoted 👌 (Mana: 5/10)