A technical analysis of the equities market now..
I was a bit caught off guard by the massive crypto market sell-off yesterday. Now I have calmed my nerves and am back to writing regular articles 😅. This article is my technical analysis of the current equities market. My next article will be a fundamental analysis, so do stay tuned. As usual, I will be using the SPY for my analysis. SPY may not be a fair representation of equities all over the world, but it is the market I am interested in and spending the most time on.
Yesterday we saw a strong bounce in the US equities market. Major indices soared more than 9% which is the best day in 12 years.
A few days back, I wrote that there is much fear in the market and we probably might see a strong bounce very soon. So we finally got it yesterday. As mentioned, I sold some put options as the premiums were super yummy.
Looking at the charts, I was waiting for a short term bounce because I saw bullish divergence flashing on the smaller interval charts. This usually means that short term selling pressure is dissipating and the sellers are probably the retail investors and not the institutions (or smart money).
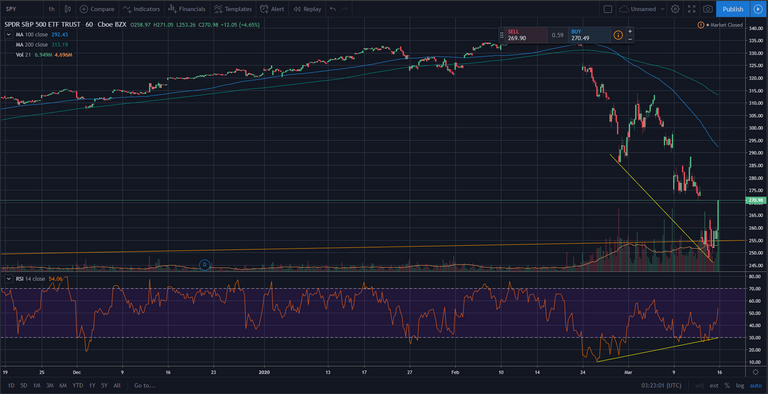
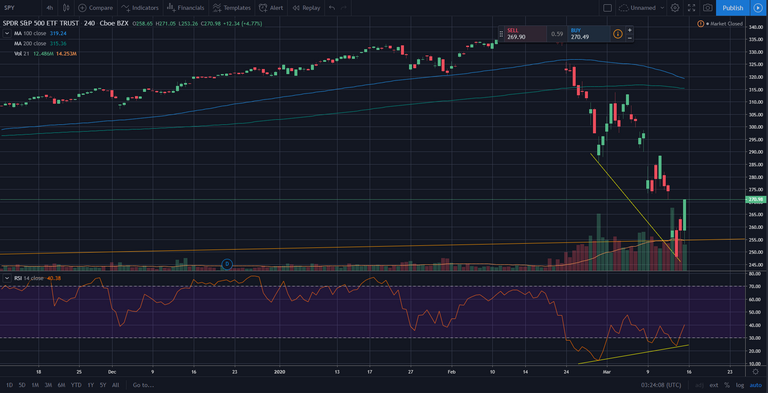
In technical analysis, the longer-term trends always dominate the shorter-term trends. However, reversals always happen in the shorter-term trends first. Hence, if you are trying to understand the overall long-term trend, always zoom out. But if you want to identify possible reversals, you have to zoom in.
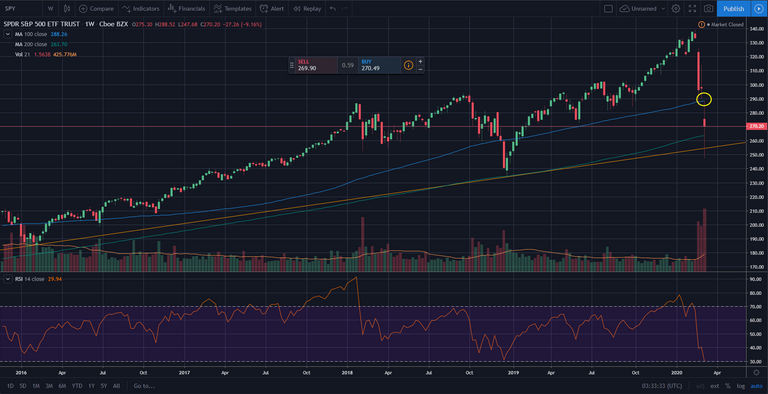
On the longer-term, we are not out of the woods yet. If you look at the weekly SPY chart below, you see that we are bouncing off some key support levels (the 200w SMA and the orange trendline). These are good signs, but not concrete. It is typical for support/resistance levels to be tested a few times so I think the market will remain relatively volatile in the upcoming weeks.
In the near term, I see the 100w SMA as a strong resistance level and the trendline as a strong support. The price is likely to hover between this 2 points in upcoming weeks as the market consolidates and decides on the next move. Also notice the small little gap I circled in yellow. Markets often like to fill those gaps. So I think the gap will be filled eventually on one of the upcoming trading days, pushing the SPY to as high as 290 or even 300 briefly.
Now, let's zoom even further out to the monthly chart.
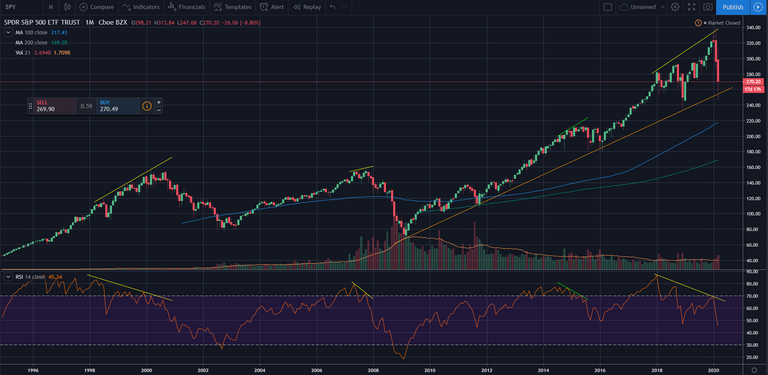
The bearish divergence is still in play on the monthly chart. As I have marked in yellow, during the dot-com bubble and the 2008 global financial crisis, we also saw the same type of bearish divergences on the monthly chart. Only this time, it seems more pronounced. Hence, my medium-term to longer-term outlook is still bearish.
However, it is also important to note that there was a bearish divergence in 2014/15 as well (marked in green) that did not really result in a massive meltdown. Another interesting chart to look at is the VIX or the volatility index. The last time we saw VIX at such a high level was during the global financial crisis.
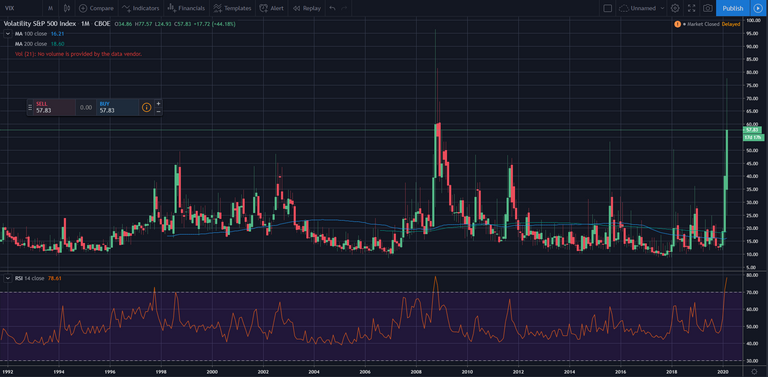
Hence, I think we can draw more parallels in this crisis with the 2008 global financial crisis. There is about the same level of fear in the market and we should be wary of that. If that is the case, then a similar price movement is plausible. In the GFC, we saw a drawdown from peak to bottom of over 50%. So if we see the same level of decline this time, a SPY price level of 160+ cannot be ruled out. Interestingly, this is also the 200m SMA level 🤔.
So, are we in for a real bounce? Or is this a dead cat bounce? We can never be sure. The best way to play in this kind of market is to tackle it blow-by-blow. I am taking it week by week and playing it defensively as my long term outlook is still bearish. In times like this there will be good opportunities for short term swing trades. But if you are those with investment horizons in the 5-10 years, I suggest to just sit out and wait for the cost to be clear.
Again, I am just sharing my thought process and please do not take it as financial advice. Due diligence can research is still required for your own investment 😄. Look out for my next article which will be a fundamental analysis of the equities market.
20% of post rewards goes to @ph-fund, 5% goes to @steemworld.org and 5% goes to @leo.voter to support these amazing projects.
Join the Steem ENS Discord server to interact with the community!
This article is created on the Steem blockchain. Check this series of posts to learn more about writing on an immutable and censorship-resistant content platform:
- What is Steem? - My Interpretation
- Steem Thoughts - Traditional Apps vs Steem Apps
- Steem Thoughts - A Fat or Thin Protocol?
- Steem Thoughts - There is Inequitable Value Between Users and Apps
- Make my votes count! Use Dustsweeper!
- What caused STEEM to get dumped? Why I think the worst might be over
- Steem 2020 is about having a "SMART U"
The analysis of stock market you gave here is so detailed. Even though I have little to no knowledge of how stock market operates but I found this very helpful. Thanks for sharing
Thanks for your kind words. I'm happy it helps
Hi @culgin
Your comparison with 2008 has a good point. However, these crazy descents that we are experiencing the de facto determinate is another, although in the end the same happened.
But even I think that blow by blow we will continue to see how it takes its place, of course, this virus crisis will play a very important role in everything that is yet to happen.
Thanks for reading and the comment