dCity Cards Historical Price Charts | How much are your cards worth?
dCity has been around for a half a year now and the game has evolved quite a bit in the period.
Recently @gerber has added the @dcityapi that is saving the data on cards prices each day.
Here we will be using this data to take a look in the recent cards prices.
dCity has more than 80 cards now if we count the citizens cards like homeless, immigrants etc. This is a bit of to much for representing them all in a post, because of what we will be looking into some of the more popular ones.
Charts will be represented for the following cards:
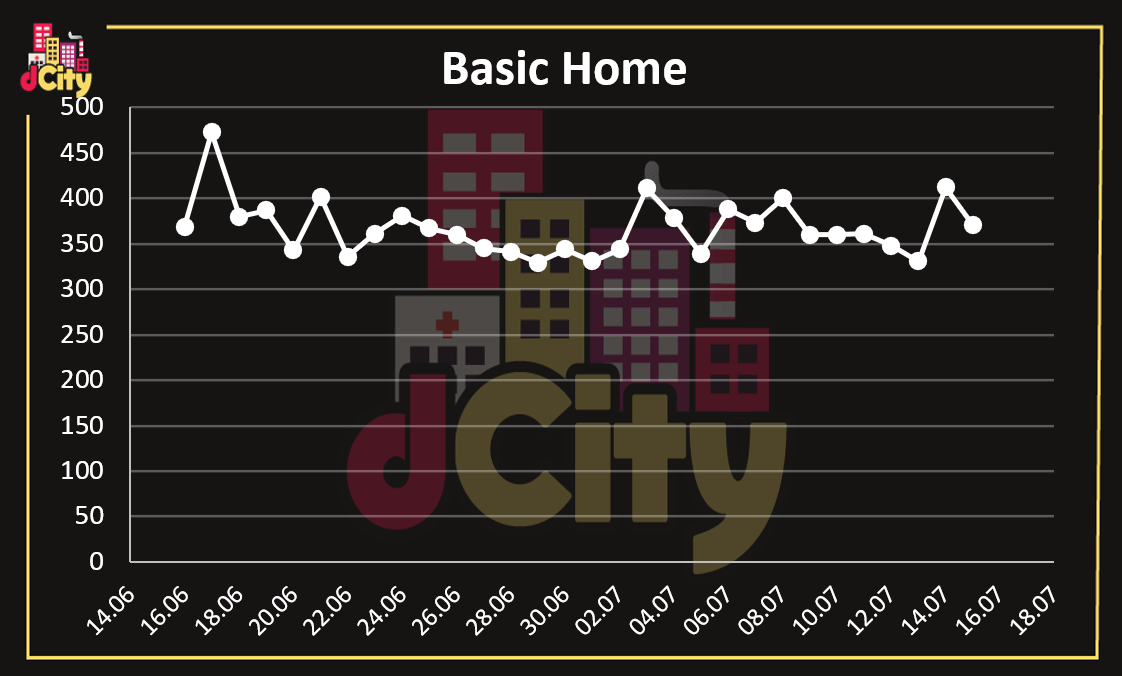
- Basic Home
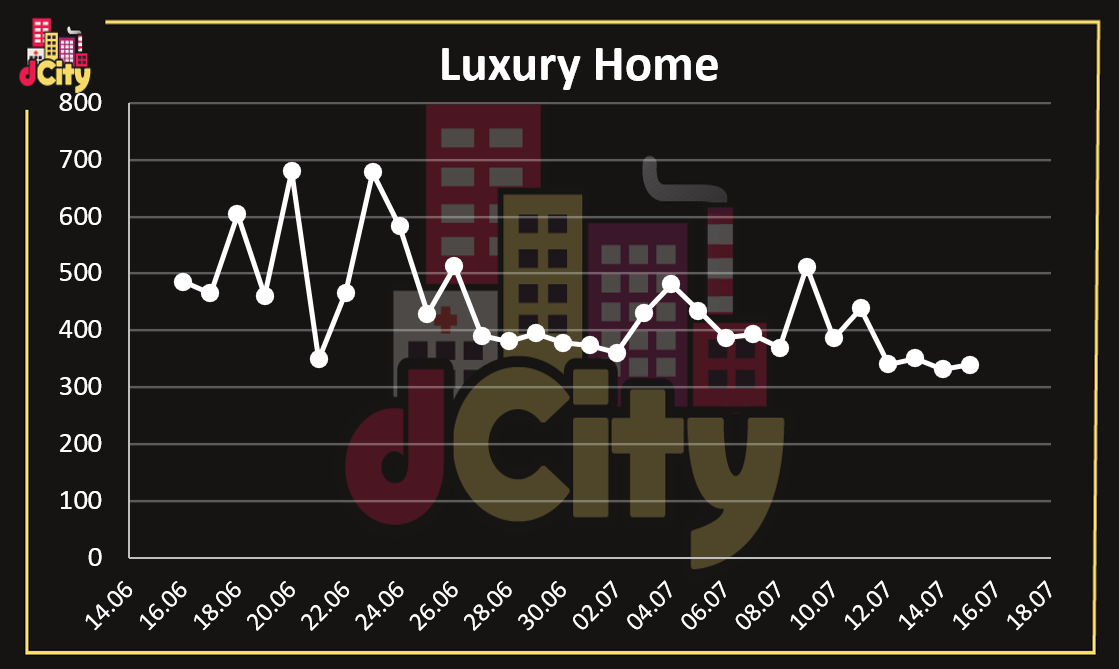
- Luxury Home
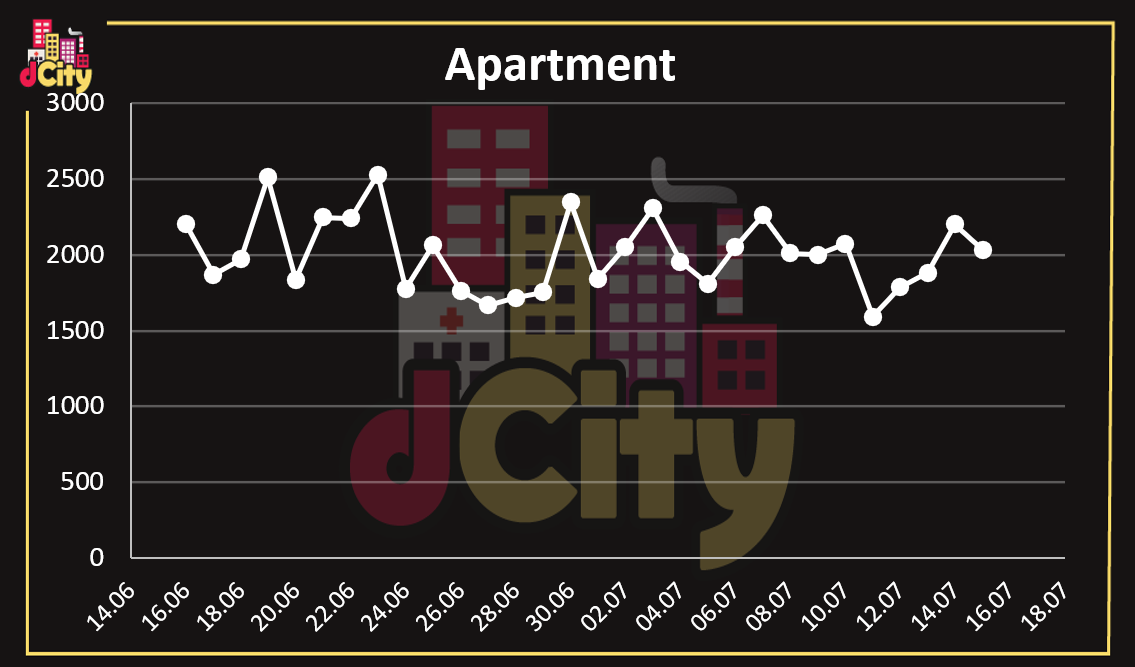
- Apartment
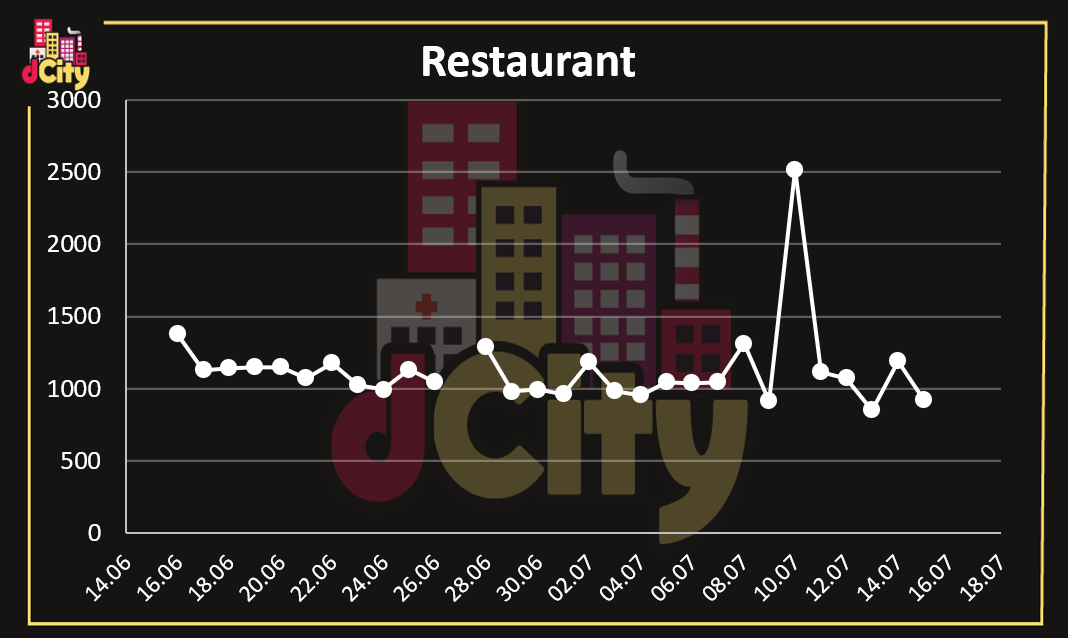
- Restaurant
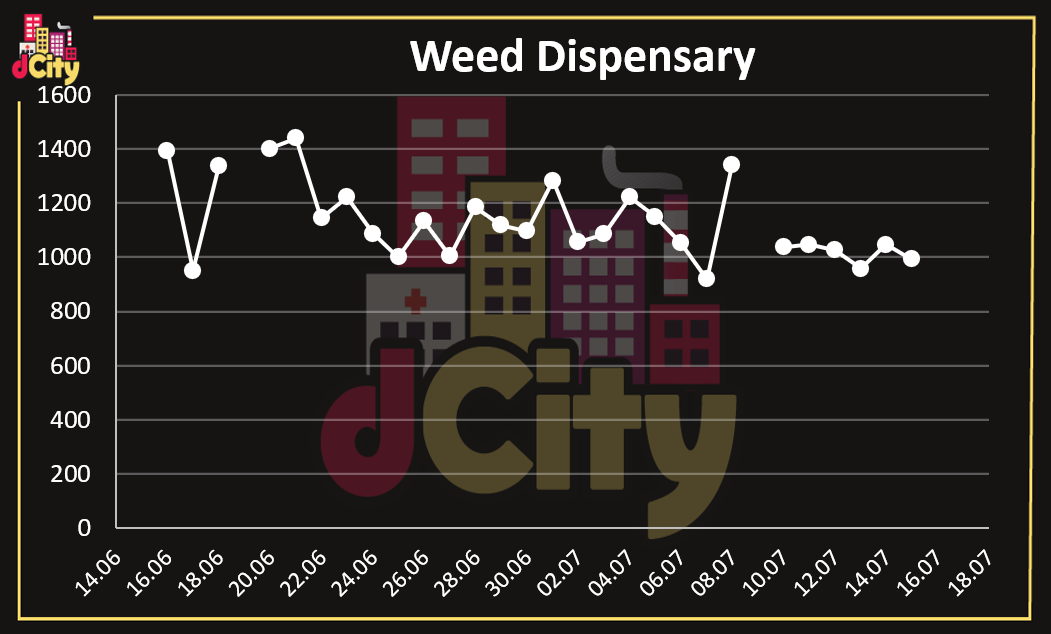
- Weed Dispensary
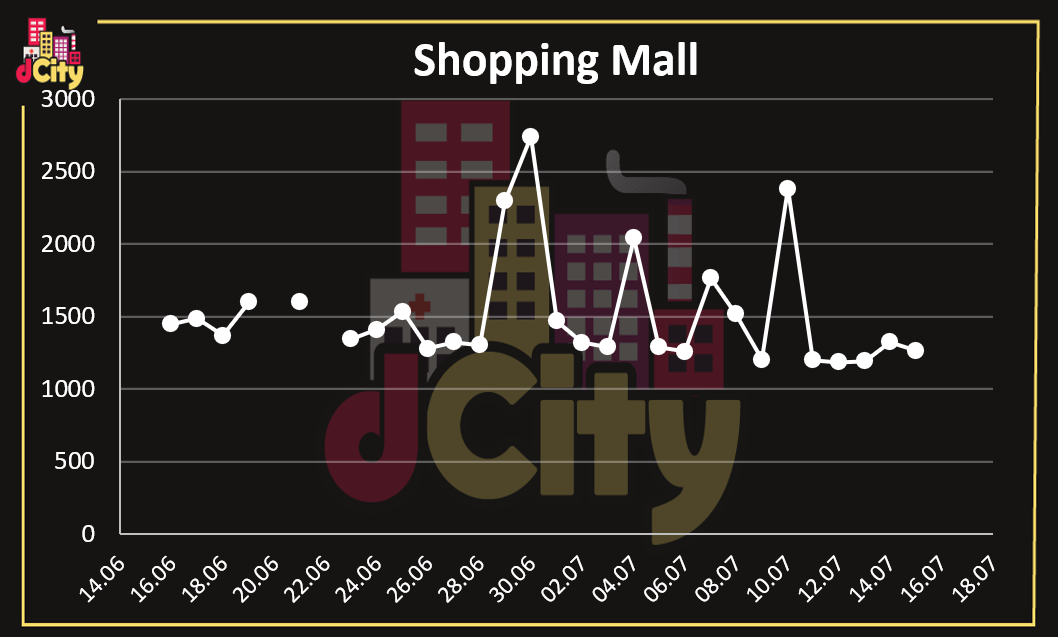
- Shopping Mall
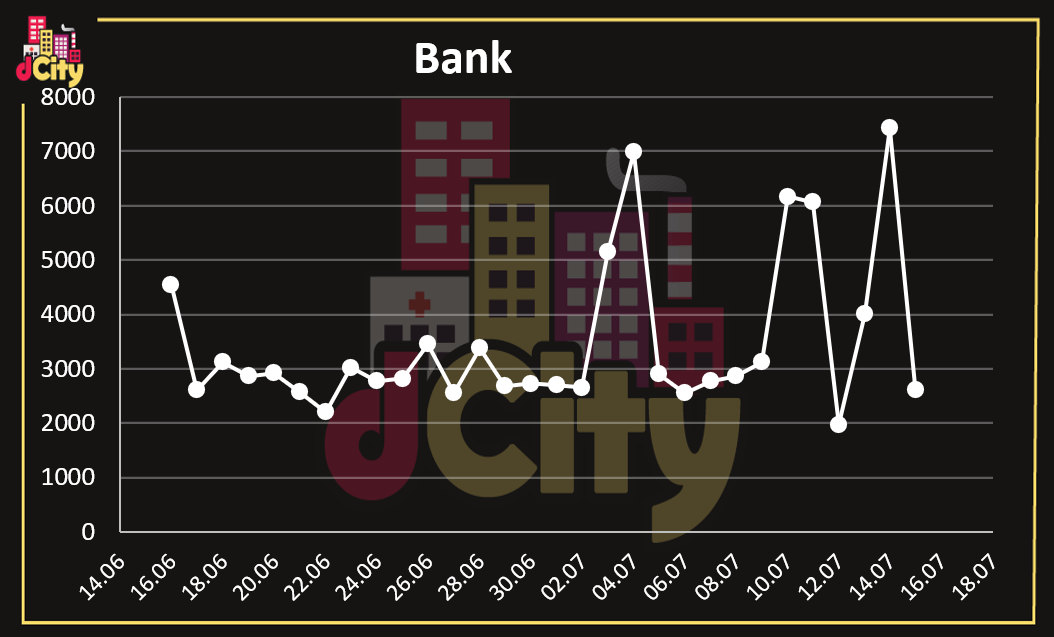
- Bank
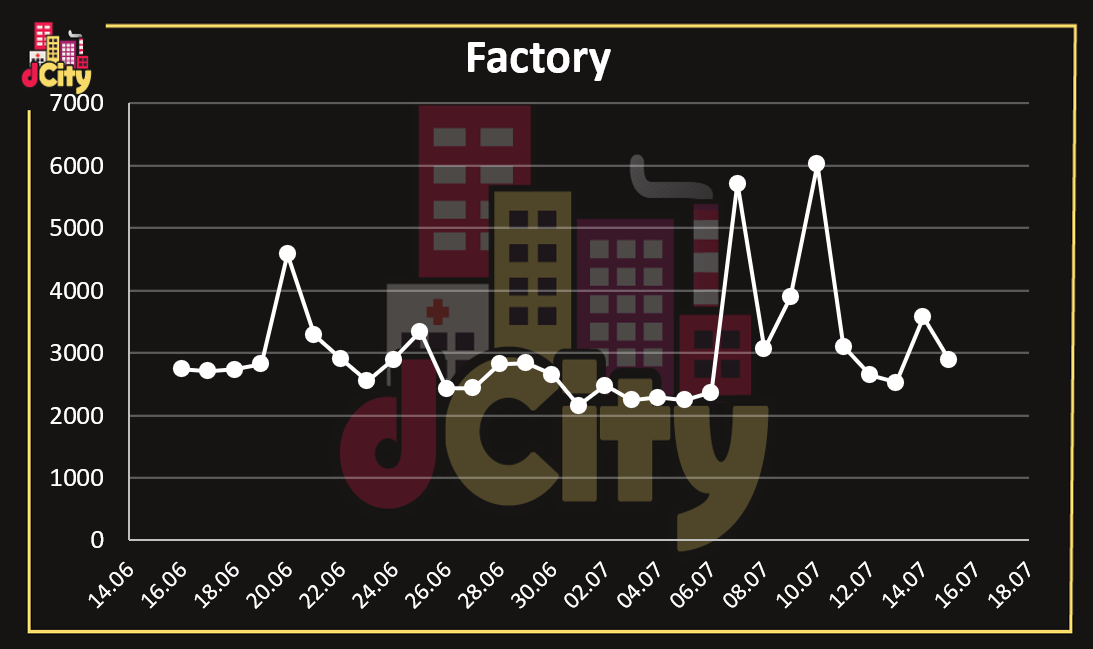
- Factory
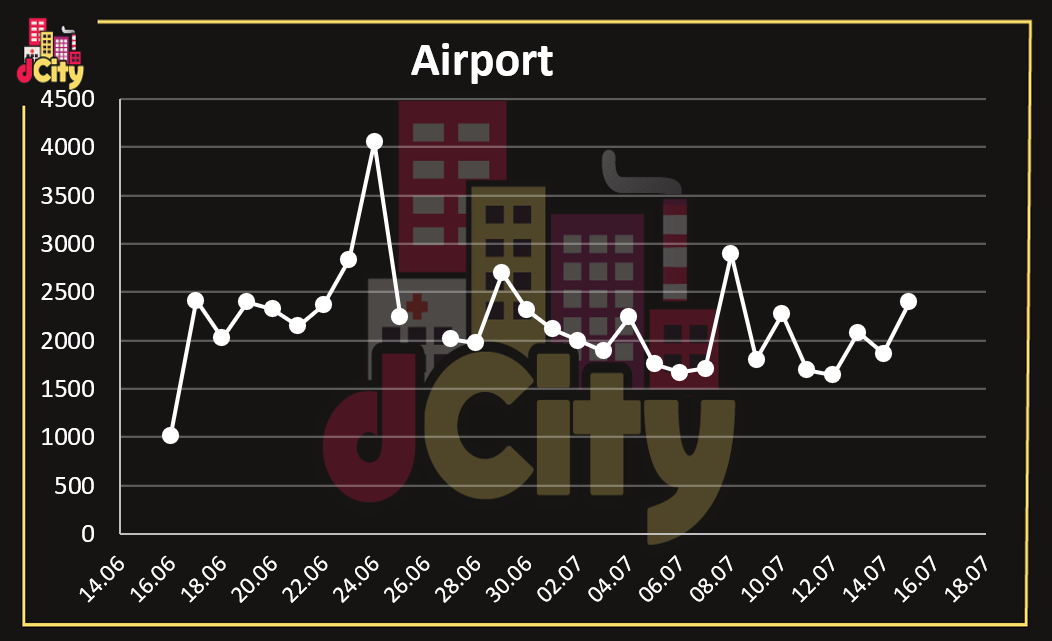
- Airport
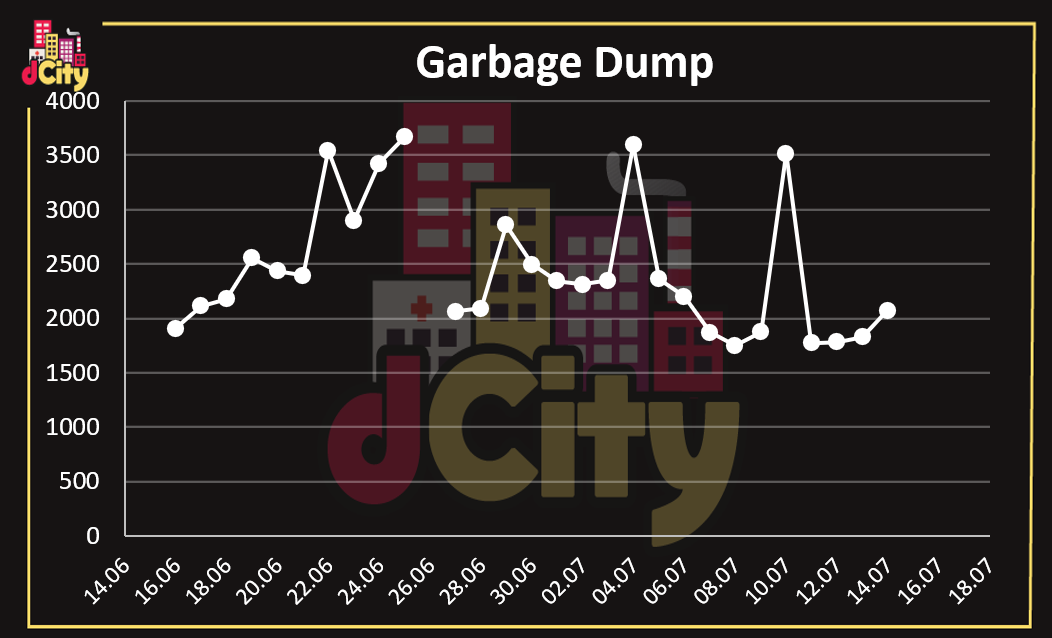
- Garbage Dump
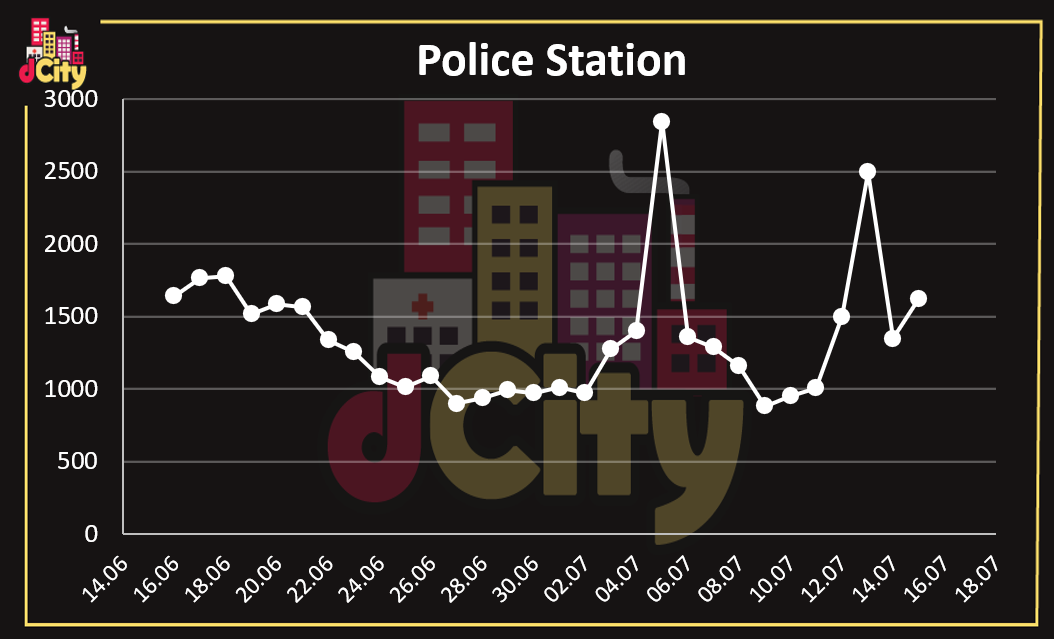
- Police Station
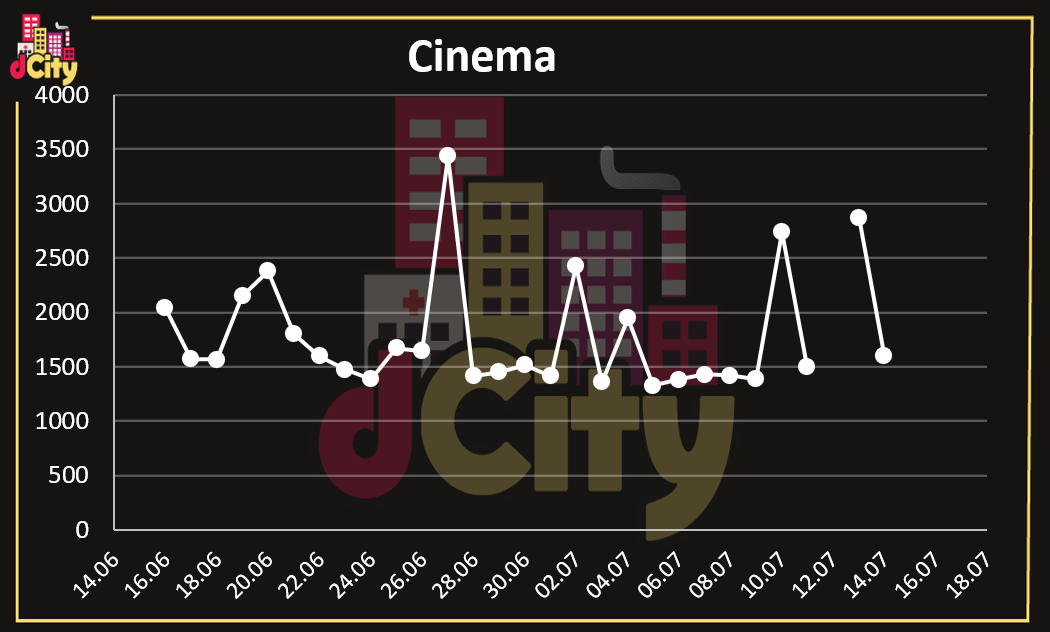
- Cinema
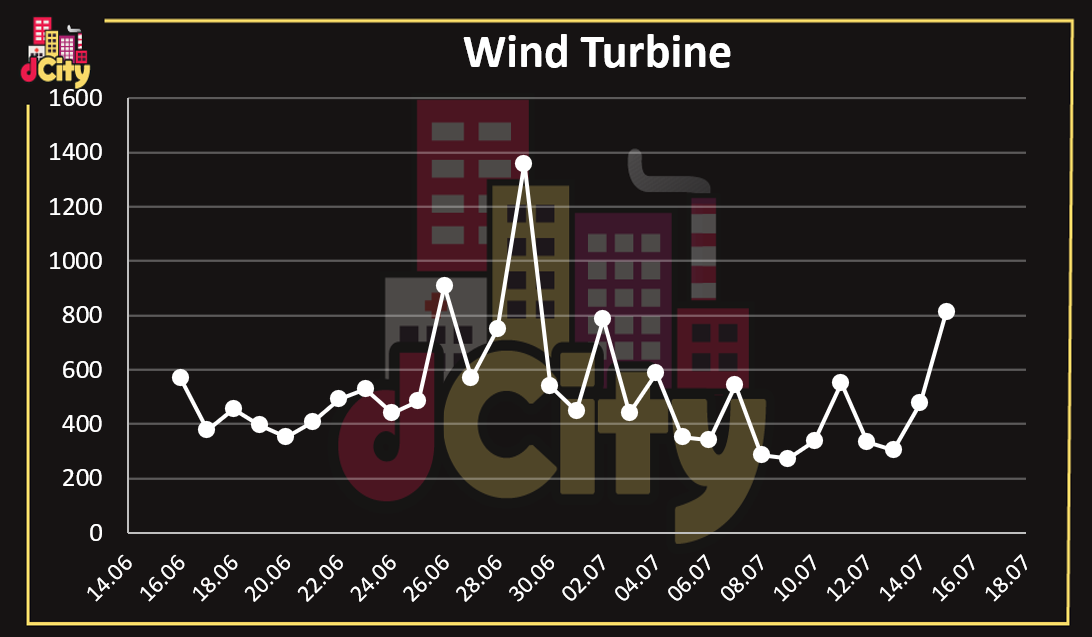
- Wind Turbine
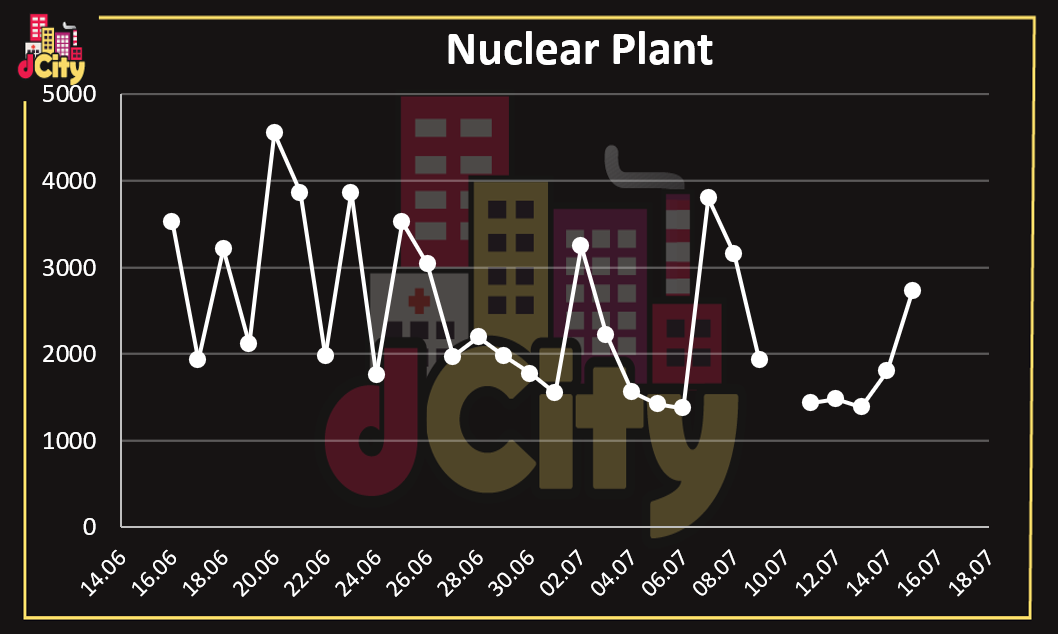
- Nuclear Plant
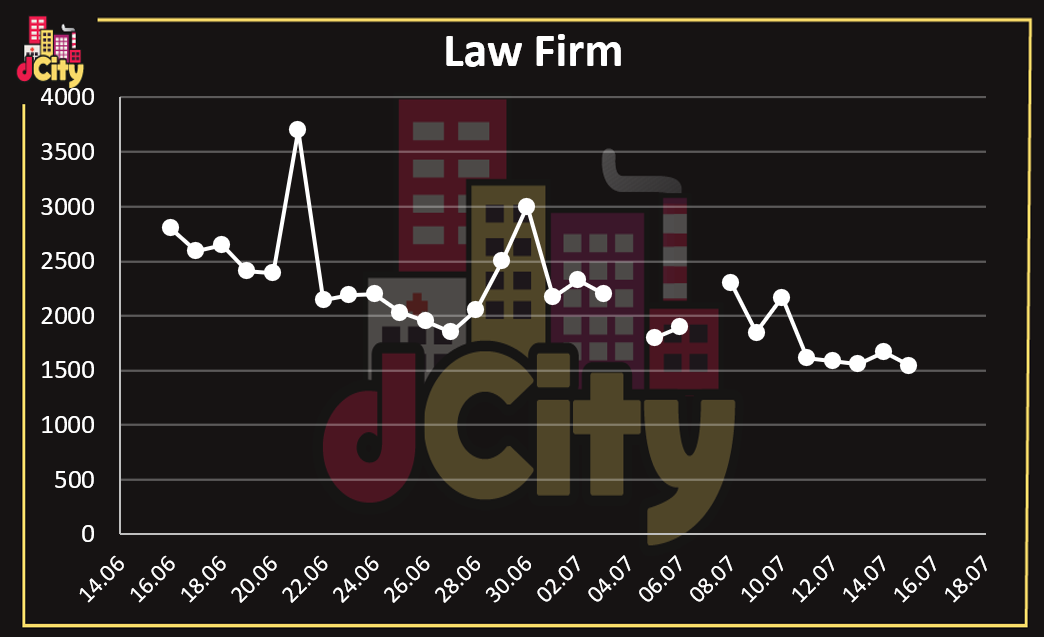
- Law Firm
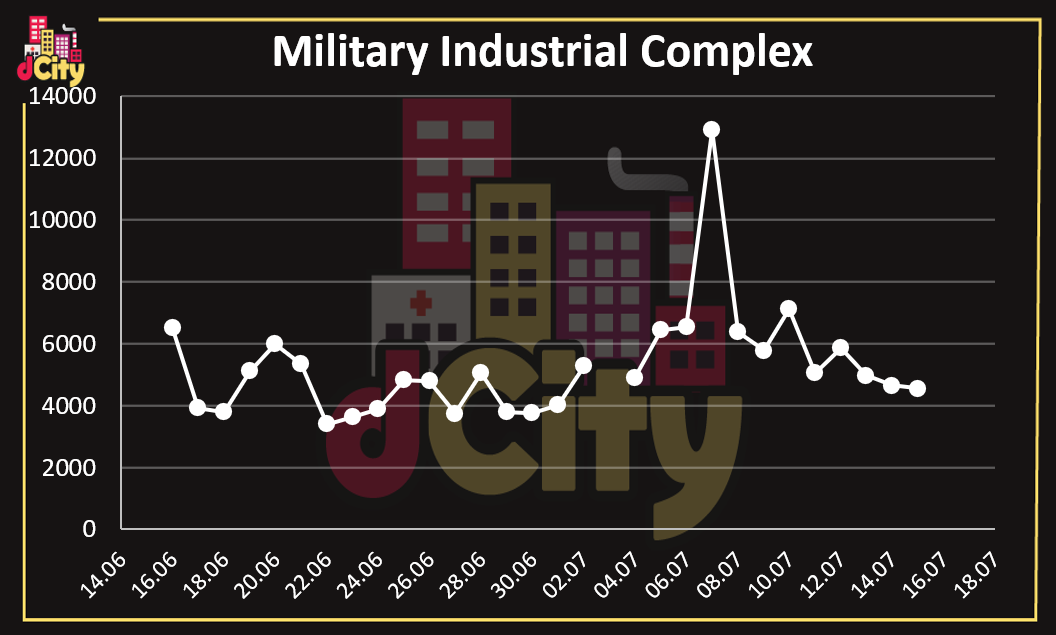
- Military Industrial Complex
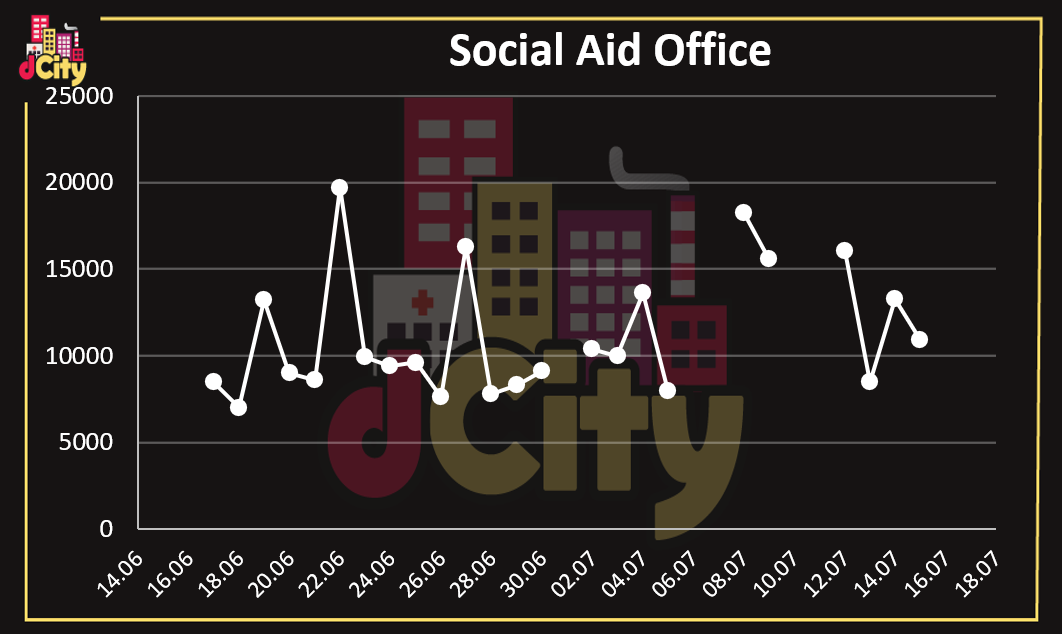
- Social Aid Office
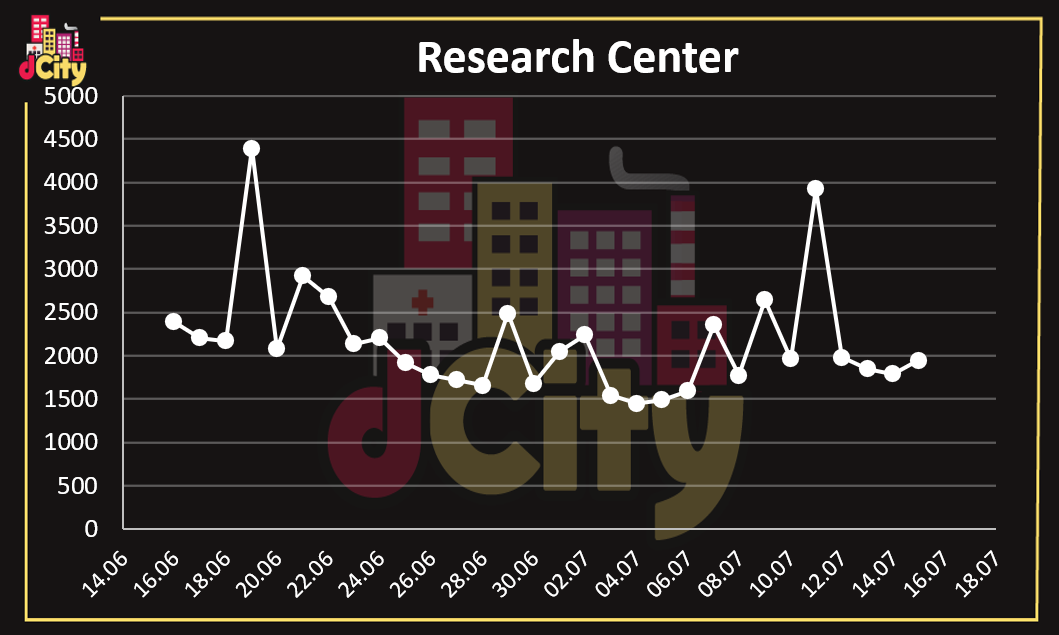
- Research Center
- Casino
Note on the data: as mentioned above I’m using the https://hiveblocks.com/@dcityapi that is saving data from Hive Engine api. As pointed out to me from @rafalski these data can be a bit wrong when bulk purchases are made. Because of this the data presented here can be incorrect.
From my observation in most cases the charts data looks fine, except when some spikes happen up or down. Because of this you can look at the charts for the average price and ignore the spikes 😊.
Basic Home
Luxury Home
Apartment
Restaurant
Weed Dispensary
Shopping Mall
Bank
Factory
Airport
Garbage Dump
Police Station
Cinema
Wind Turbine
Nuclear Plant
Law Firm
Military Industrial Complex
Social Aid Office
Research Center
Casino
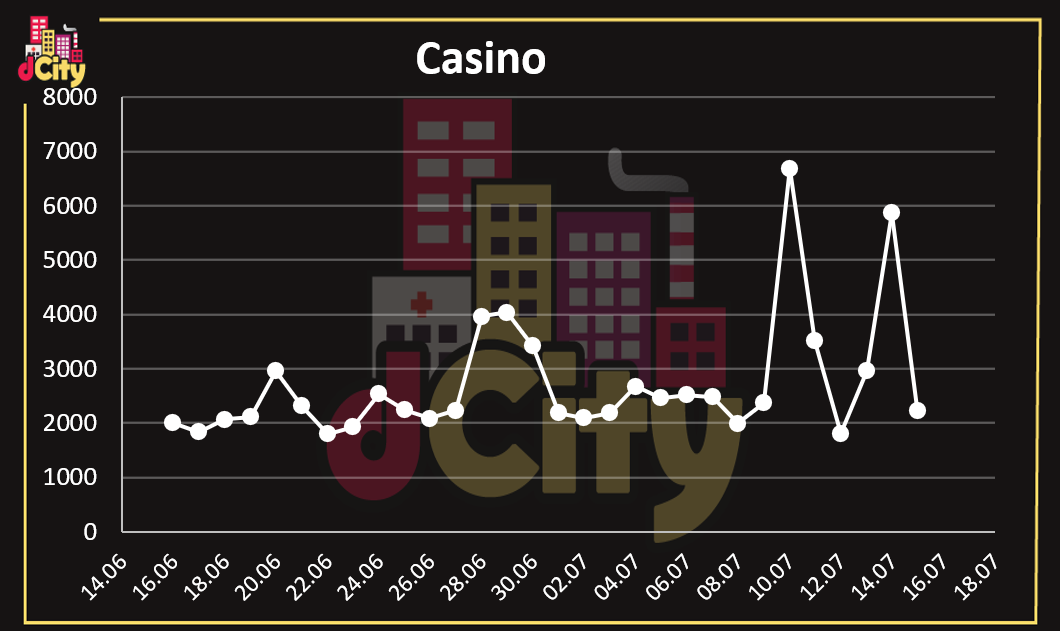
Overall looks like the cards are holding their value pretty stable.
Will be interesting if/when the first edition stop being printed somewhere in the future and see how that will affect prices.
All the best
@dalz
Posted Using LeoFinance
WOW - I'm always totally fascinated by your statistic.
Normally I say: do not trust any statistics you did not fake yourself.
But yours are perfect and give very interesting information.
It looks like most of the cards are more or less stable.
Which is good because we had other games where we could see a very clear downside trend.
Thanks a lot for sharing and
HIVE ON!!!!
Posted Using LeoFinance
Thanks for the nice words.
Cards seems stable yes :)
cool information.
Is there already a tool to monitor my city over the time with some stats an so on??
Thanks!
Rafalski have some at https://hivedata.space/statistics/dcity
thanks cool tool
I'm working on personal stats overwiew (city)
Cool, I look for something like a management tool to see how the city develops over time or to set goals and plan a way to reach that goals
Awesome info, look forward to seeing the graphs in a couple of months.
Posted Using LeoFinance
Thanks!
Yep will be interesting to check them out later!
Posted Using LeoFinance
Can we conclude that the police stations have those spikes because of the way the recent change in taxes have caused a surge in crime?
What would you say is causing wind turbines and nuclear plants to increase in value? Something to do with technologies making them more lucrative?
Posted Using LeoFinance
As mentioned above I would not look at the huge spikes, those are most probably errors in the Hive Engine api data.
But overall the cards that you mentioned, police station, wind, nuclear ... are showing up trend.
Police is because of the tax, and yes nuclear, wind and solar have tech cards that make them better.
Posted Using LeoFinance
Thank you for the statistics 😊
Congratulations @dalz! You have completed the following achievement on the Hive blockchain and have been rewarded with new badge(s) :
You can view your badges on your board And compare to others on the Ranking
If you no longer want to receive notifications, reply to this comment with the word
STOPDo not miss the last post from @hivebuzz:
Support the HiveBuzz project. Vote for our proposal!