HIVE Power Up and Power Down| Data by date, operations, and users | Who is powering up/down the most?
Here is some data on the HIVE Power UP and Power DOWN. Hive has been around since March 21st. Usually when a new project comes around there is a period of volatility at first and later a balance is found. We have seen this with the HIVE price.
@thepeakstudio image
Before we represent the numbers, I just want to emphasis the HIVE payouts. As we know they are made half liquid, half powered up. What this means that a share of the inflation is put in circulation already powered up. When we see numbers in favor of power down have in mind that this is mainly because of the starting point of that HIVE.
If all the HIVE was put in circulation as liquid, then me can make a fair comparison between the power up vs power down tokens. As 50% of HIVE is put in circulation as powered up, it is expected that in most cases the numbers will be in favor of power downs.
Because of this, hivers should not be as concerned when numbers favor the power downs, as long as it is less then double 😊.
We will be looking at:
- HIVE powered up by date
- HIVE powered down by date
- Power UP VS power down
- Number of power up operations
- Number of power down operations
- Top 20 Accounts that powered up
- Top 20 Accounts that powered down
The period that we will be looking here is March 21 till July 9, 2020.
HIVE Powered up by date
Here is the chart for the HIVE powered up by date.
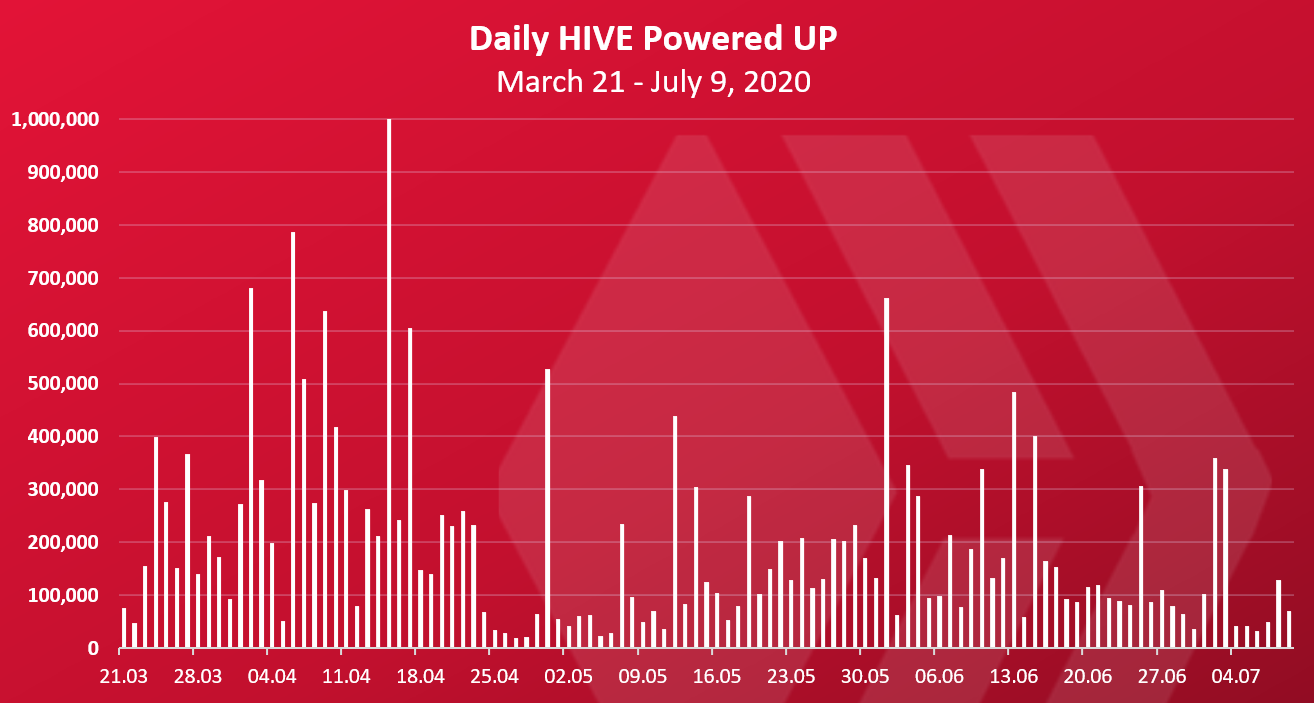
As mentioned above we are seeing some big numbers at first, it’s the volatility of a new project and the numbers go down. Around April 25th and just after that there is even bigger drop. This is mainly because of the HIVE price in those days when it reached almost a 1$.
In the last 30 days the average HIVE powered up is around 150k per day.
HIVE Powered down by date
The power down chart looks like this.
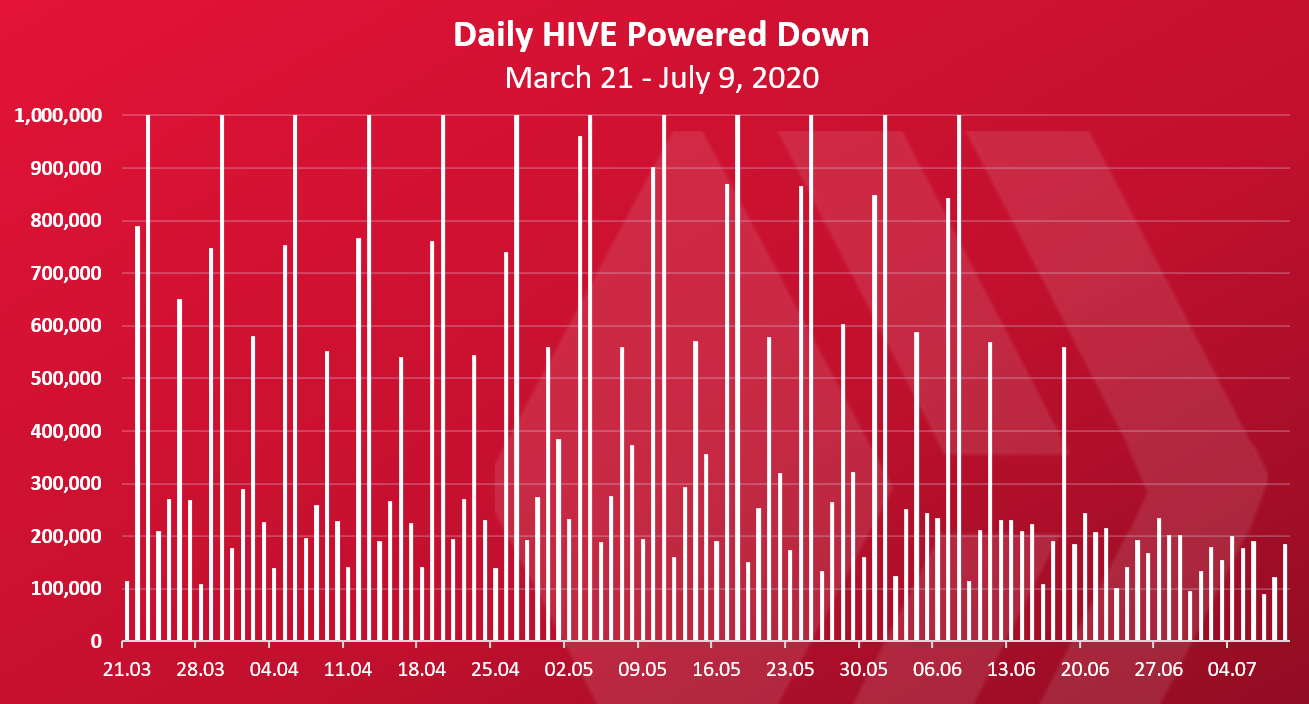
The big spikes up until June are the exchanges powering down, Binance and Huobi.
In the last 30 days the average power down is 200k per day. If we compare this to the 150k average power up it’s a -50k difference per day, but still not double. I point out the double thing because of the note made above, where 50% of the inflation is rewarded as HIVE power. Meaning more of the HIVE inflation still stays powered up.
Power UP VS Power Down
Here is the chart with the difference in HIVE power up VS power down.
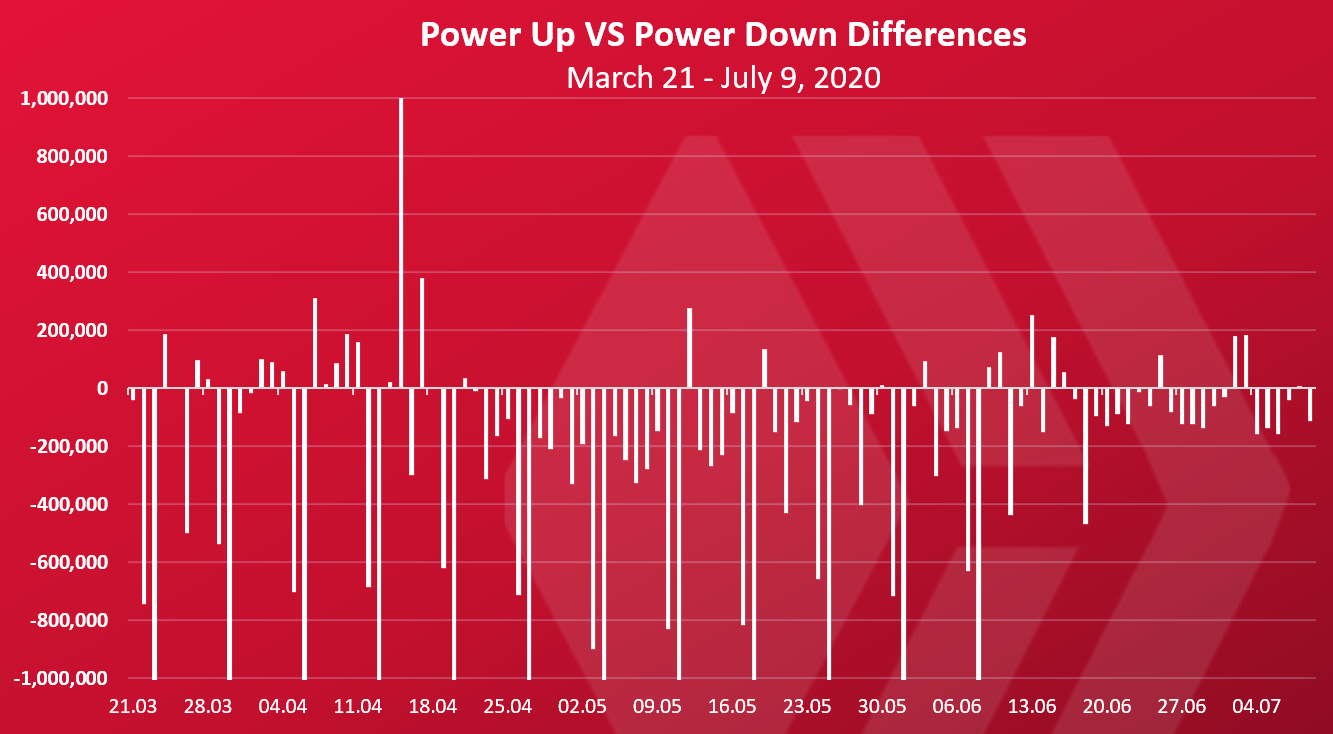
Note again on the exchanges powering down.
The chart above is for finished power downs. When account start powering down the stake becomes liquid in the 13 weeks period 1/13 each. The above is stake that has become liquid, not started PD.
If we zoom into the last 30 days, where there is no more exchanges powering down the chart looks like this.
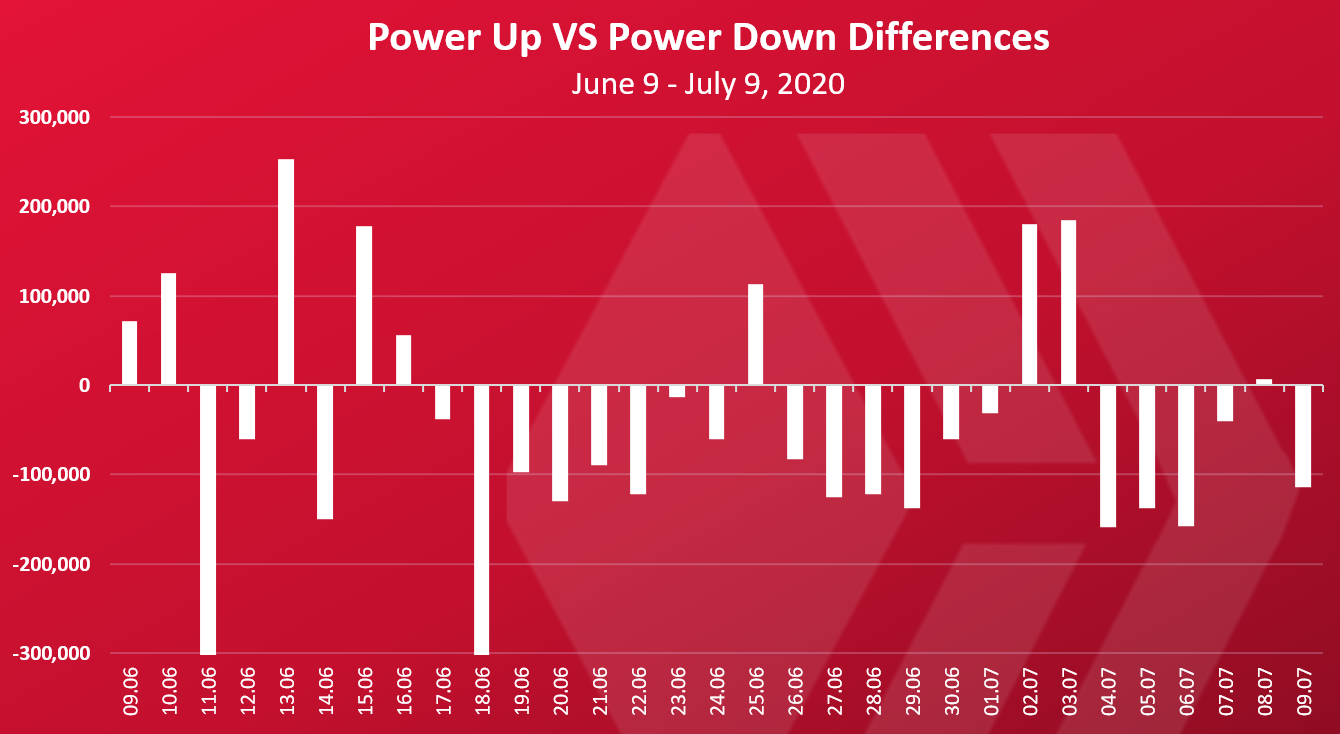
Out of these 30 days there is 8 days when there is more HIVE powered up then powered down.
A total of 4.6M HIVE was powered up in the period above and 6.3M HIVE powered down. A difference of 1.3M HIVE. On average there is 54k daily more powered down.
Number of power up operations
The above is in terms of stake. But how many operations for powering up were made. Big and small accounts.
Here is the chart.
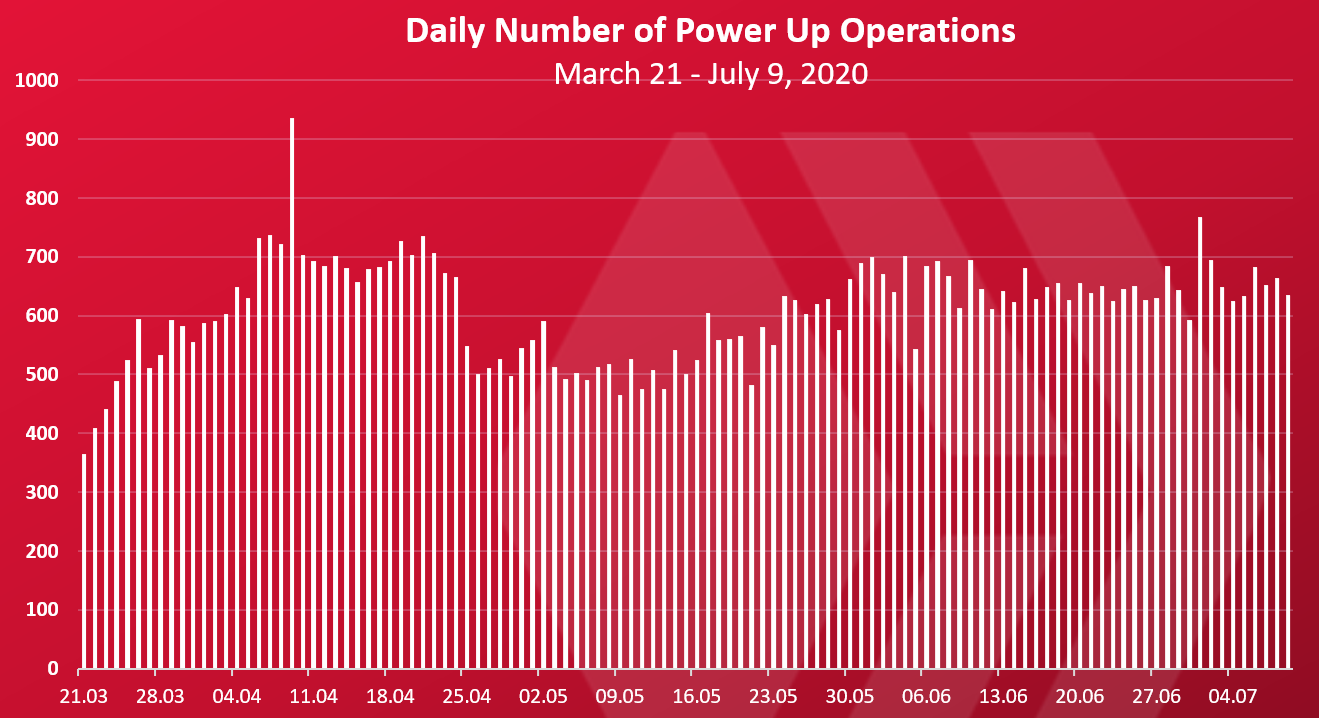
We can see a clear increase in the number of daily power up operations after the Hard Fork, from around 400 to 700 daily operations with a record number of 935 power up operations on April 9th.
Here as well we can see a slight drop in the number of operations just after the price of HIVE increased on April 24th. Afterwards we have some small growth in the number of power up operations in the range between 600 to 700.
Number of power down operations
The chart for the power down operations looks like this.
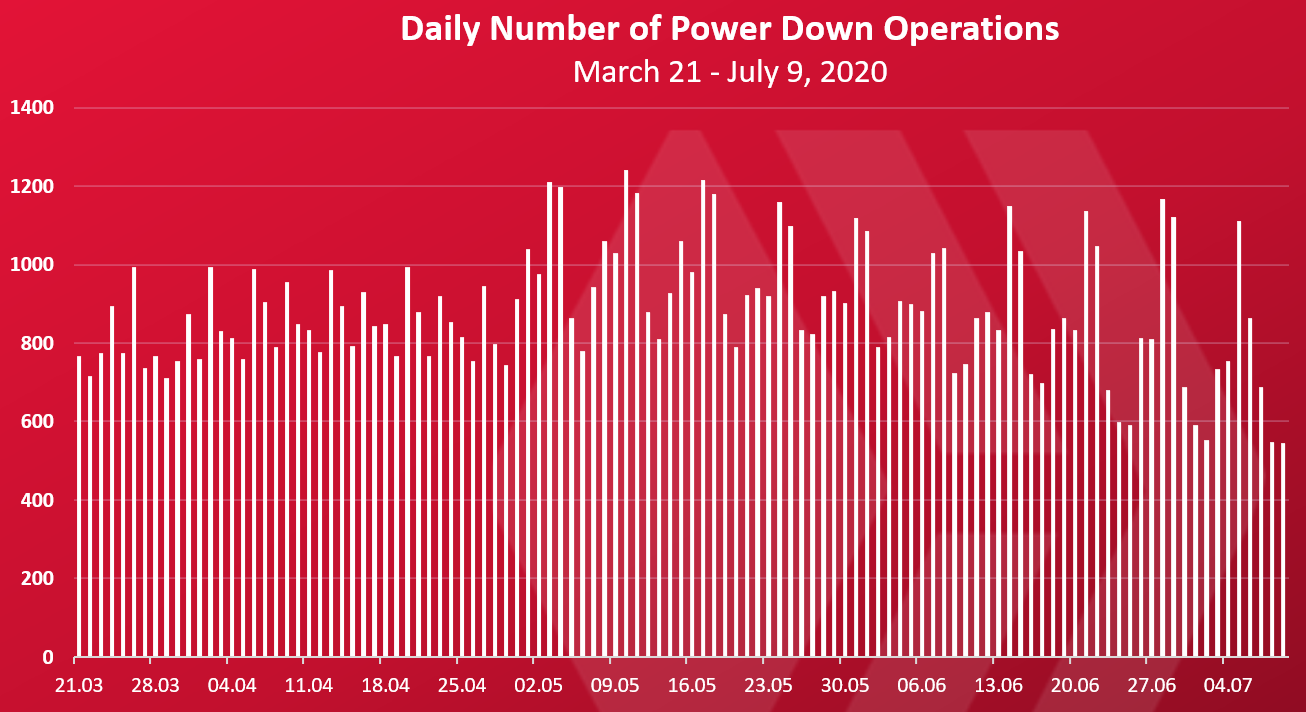
Looks like there is a down trend in the last period with some spikes in between.
The average number of power down operations in the last 30 days is around 800.
Started Power Downs
Here is the chart for the started power down stake
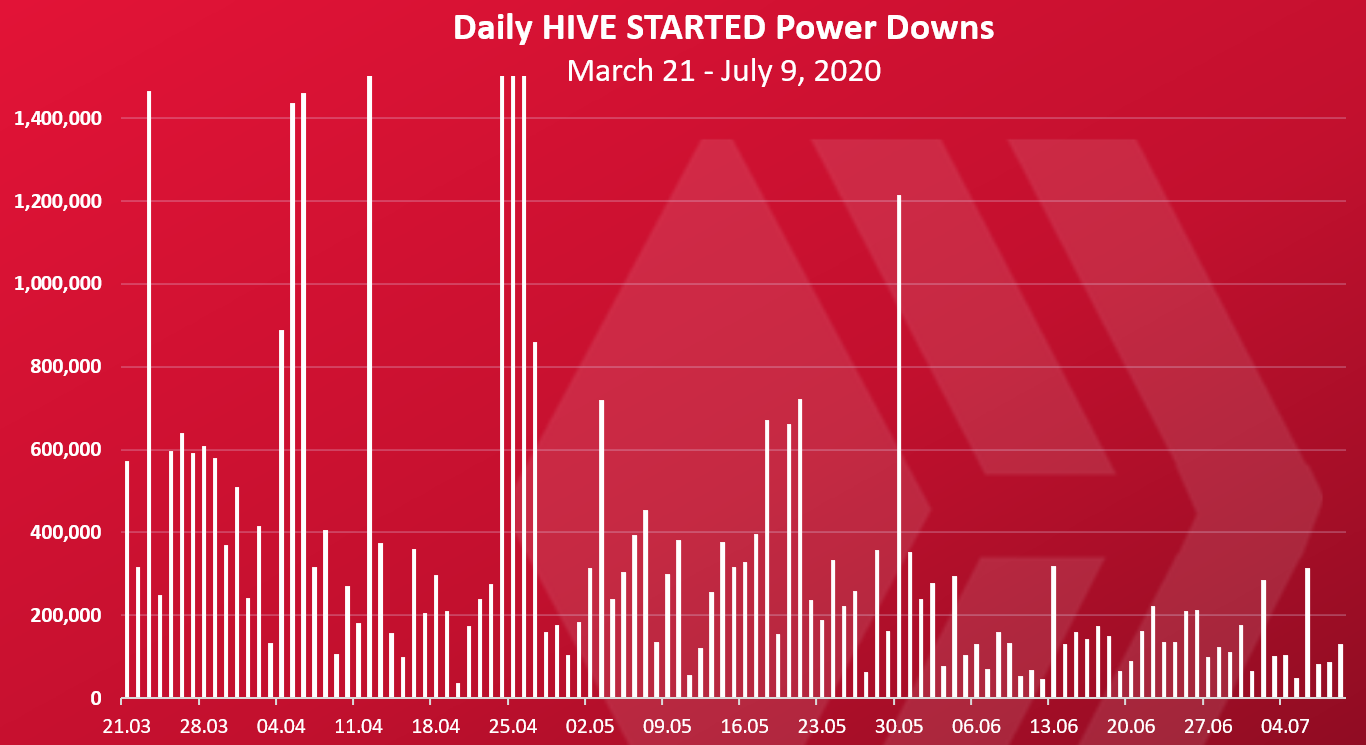
A clear down trend here, with some massive power downs at the beginning, and around the time when the HIVE price spiked, and then low numbers. In the last period the amount of HIVE put into power downs is around 140k per day.
Top 20 Accounts that powered up
Who is powering up the most?
Here is the chart for the period between June 9 – July 9, 2020.
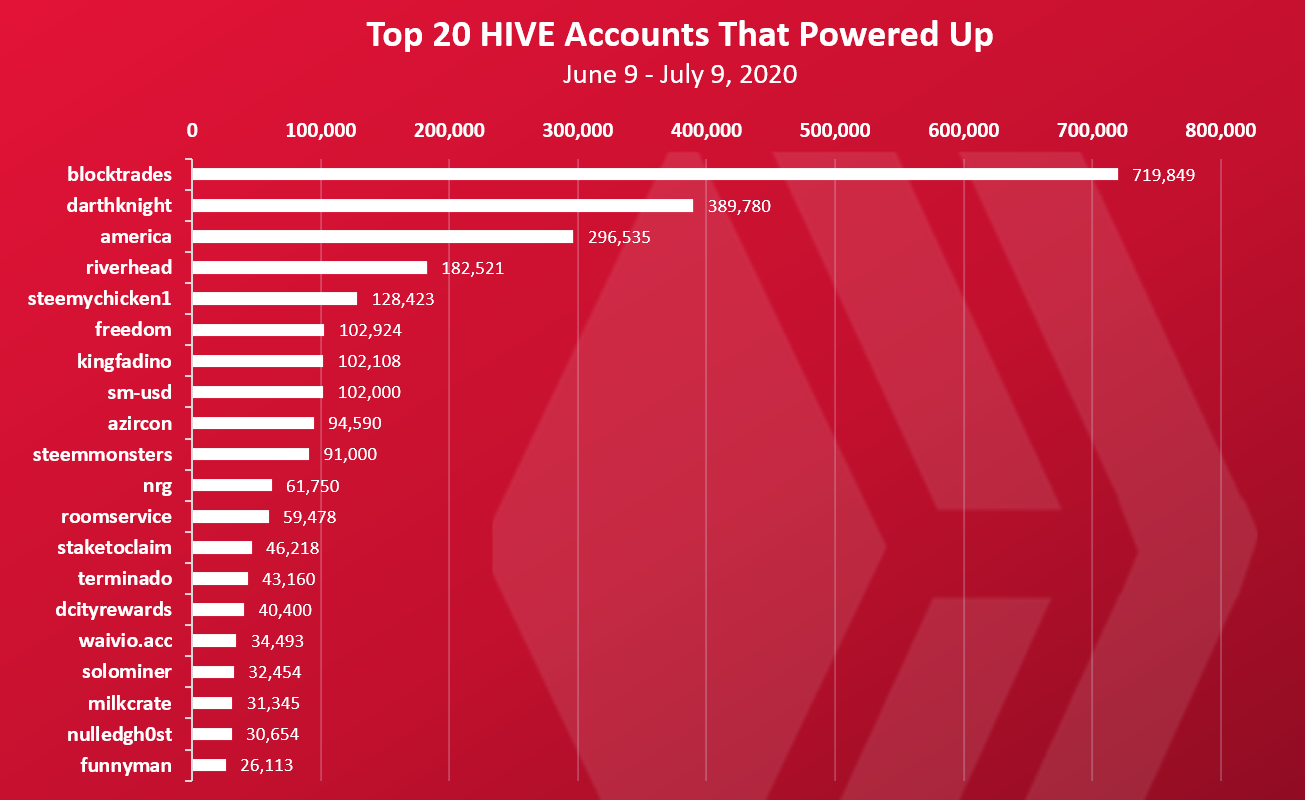
@blocktrades comes at the top, with more than 700k powered up, followed by @darthknight and @america.
Top 20 Accounts that powered down
Who is powering down the most?
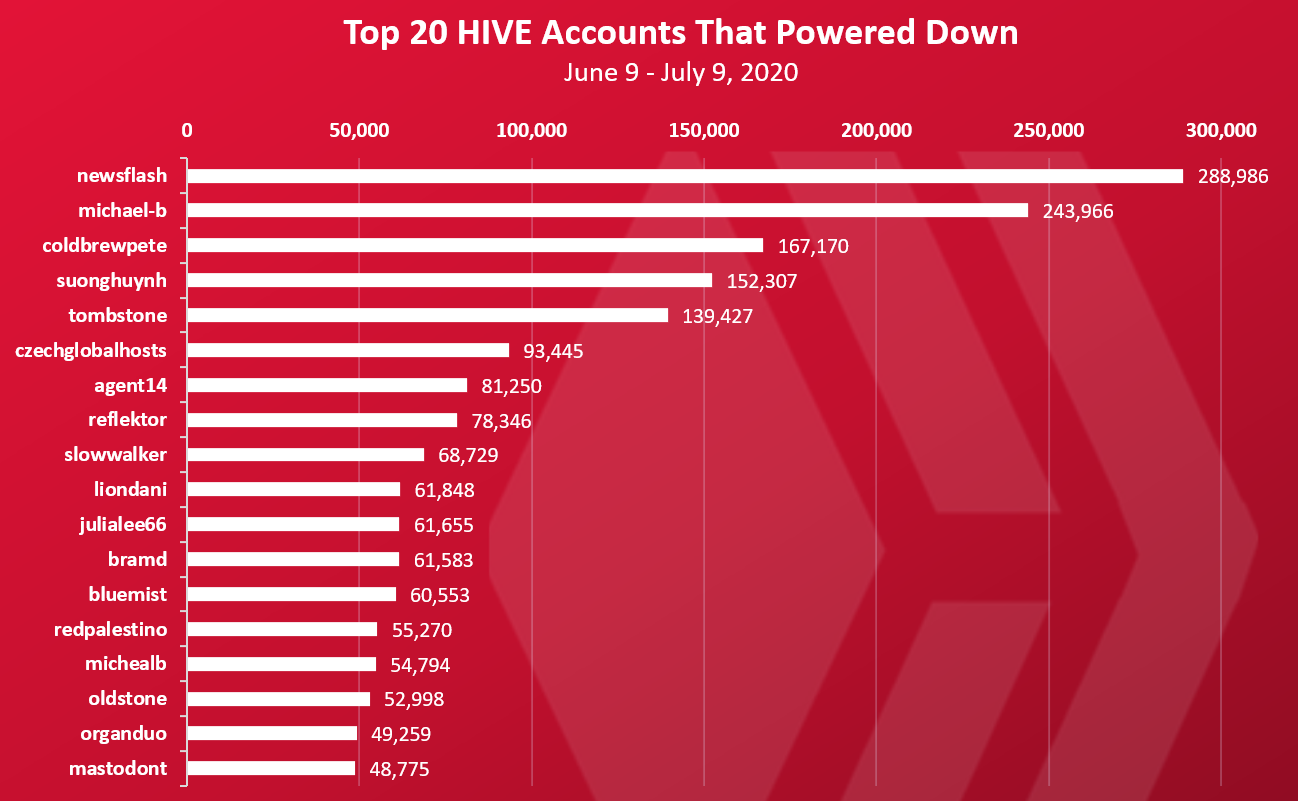
@newsflash at the top with almost 300k, followed by Michael-b and @coldbrewpete.
At the end note on the total share of HIVE powered up. Currently there is a total of 137.4M powered up, out of the total 362.3 HIVE supply. Its 38% share. This is quite a low share of HIVE powered up mostly because of the 83.3M liquid HIVE in the DAO/DHF, that were powered down from the Steemit Inc accounts and transferred there. If we add this to the above the total share will be more than 200M and more than 60%.
For example, on Steem currently there is around 143M Steem Power but with the Steemit Inc stake included. If we exclude that (~80M) this number will be just above 60M users’ funds powered up, out of the 360M total.
Because of this low powered up share, the staking rewards (15% of the inflation) are quite high now and are at 3.35%. The smaller the share of Hive Power, the more Hive Power earns staking rewards. This doesn’t include the curation rewards, that also grows.
All the best
@dalz
Posted Using LeoFinance
Congratulations @dalz! You have completed the following achievement on the Hive blockchain and have been rewarded with new badge(s) :
You can view your badges on your board And compare to others on the Ranking
If you no longer want to receive notifications, reply to this comment with the word
STOPDo not miss the last post from @hivebuzz:
Support the HiveBuzz project. Vote for our proposal!
Tweet:
https://twitter.com/Dalz19631657/status/1282095650176479233
Yes this makes sense due to price decrease.
I hope we will have more power ups then downs in this price range.
Its not as bad still :)
You are right.
Gimme more HIVE...I'll power it all up!!! lol
Awesome stats man, great to see the blockchain 'by the numbers'.
Thanks man!
Sometime these data won’t tell us how enthusiastic our $HIVE community for the future of our hive
Posted Using LeoFinance
Cant put that in numbers :)
Totally agree.
These Numbers helps.
Keep up the good work man.
.
Thanks @crokkon!
I used
transfer_to_vestingonly.But interesting point to include the author and curation rewards.
This one is indeed one of the helpful data you need to watch for on a regular basis. Followed you, my friend