Overview of the key Ethereum metrics | Supply, Activity, Hash Rate, Wallets, Transactions| October 2020
With the recent DeFi hype Ethereum has once again show to be the focal point of crypto development and innovation. It happened before with the ICOs in 2017 and now again with the DeFi projects.
No doubt there is a lot of speculation, but some of the projects have real value and innovation in them that can be truly revolutionary. A lot of other projects are aiming for Ethereum place, but up to this point they just seem to follow. Innovation happens on Ethereum and the others copy. When you follow, you can never lead 😊.
Having in mind that at this moment Ethereum is the place to be, a lot of the other crypto projects are building bridges to Ethereum.
Let’s take a look at some of the key Ethereum metrics.
For this mainly I will be using the etherscan charts and some glassnode charts as well.
Supply
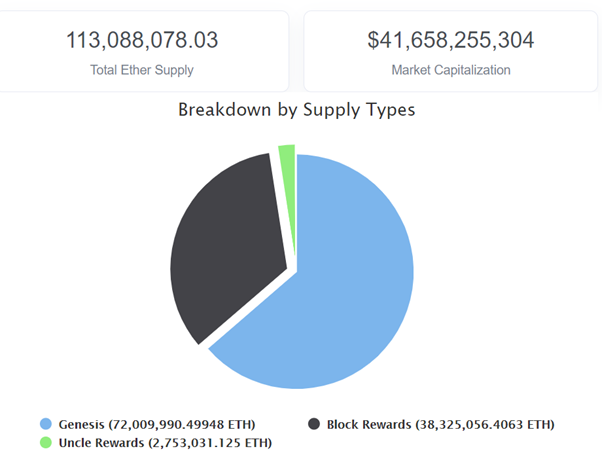
The supply is always an interesting topic in crypto. Here is the Ethereum supply.
source
At the moment of writing this, October 19, 2020, Ethereum has a total supply of 113M coins.
Ethereum had a presale in 2014, where 60M ETH ware sold to investors and 12M ETH was allocated to a development fund. Since then 41M ETH were mined and added to the supply.
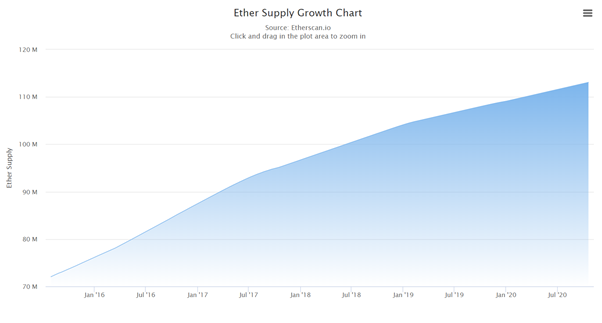
Here is the chart for the ETH supply over time.
source
As mentioned 41M ETH in total were mined since its inception. We can see that the supply is slowly increasing. In the last one year period an approximate 5M ETH more was added to the supply. The year before that around 6M.
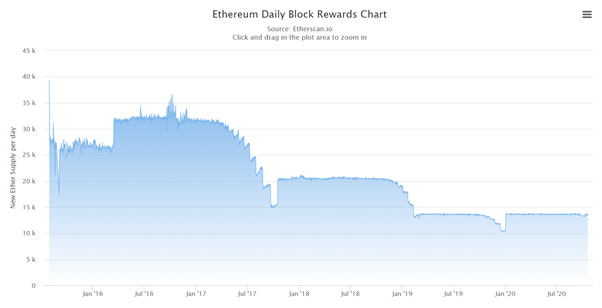
The block rewards chart looks like this.
source
Number of addresses
Another key metrics for crypto projects is the number of wallets.
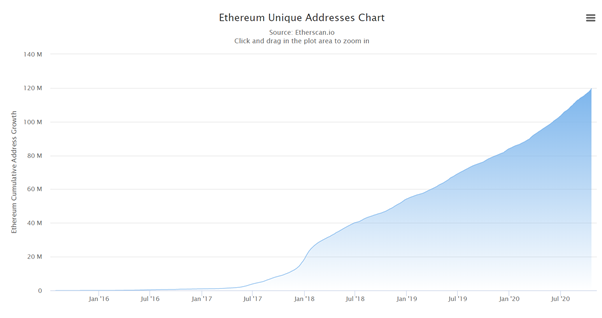
source
The number of ETH wallets addresses has been growing at a fast rate and now it almost has 120M. It is the crypto with the highest number of wallets. For comparison Bitcoin has around 55M wallets at the moment.
Active addresses
How many of those 120M addresses are actually active?
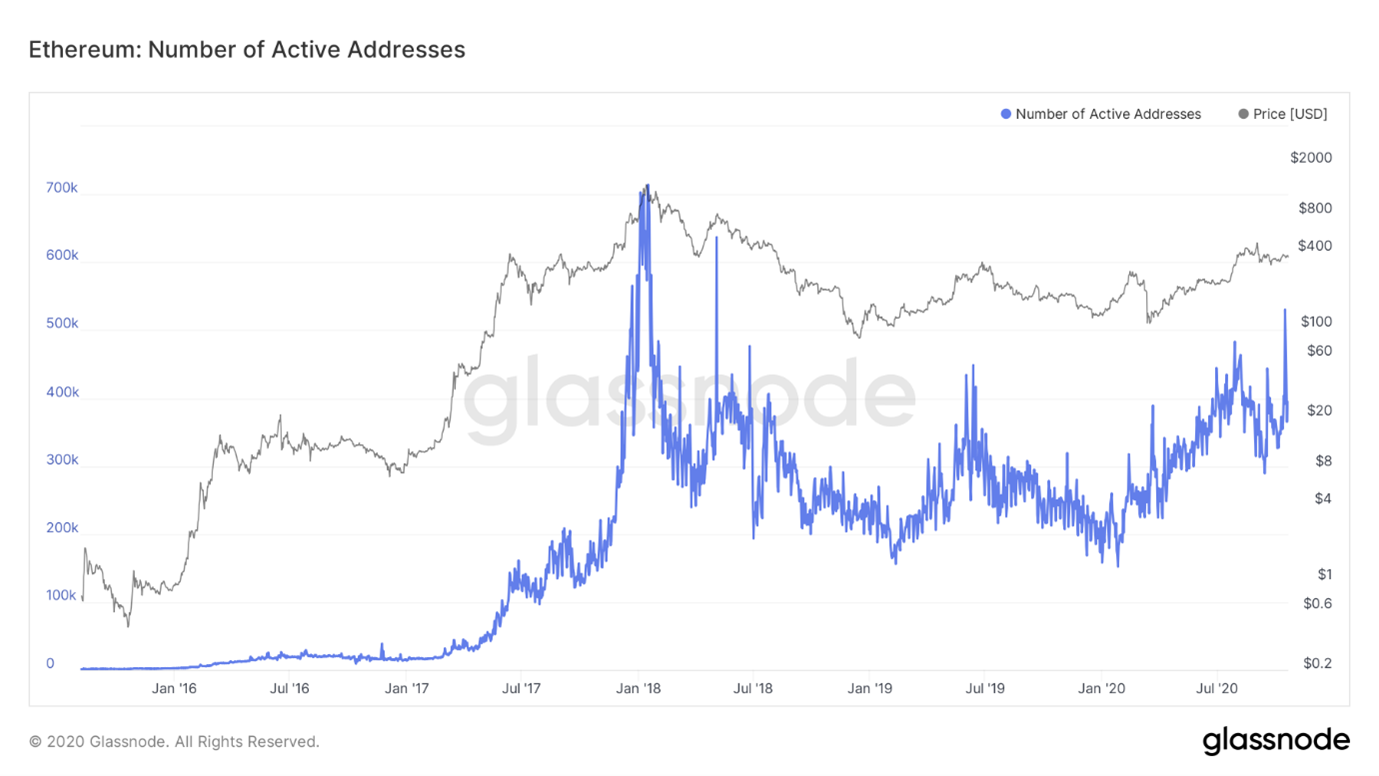
source
According to Glassnode the number of active addresses (the blue line) has just spiked reaching more than 500k active addresses per day. This is still lower from the ATH numbers in January 2018 when there was more than 700k active addresses per day.
Hash Rate
The network security in a proof of work chain is measured in hash rate, or how difficult is to mine. The bigger the completion, the higher the hash rate.
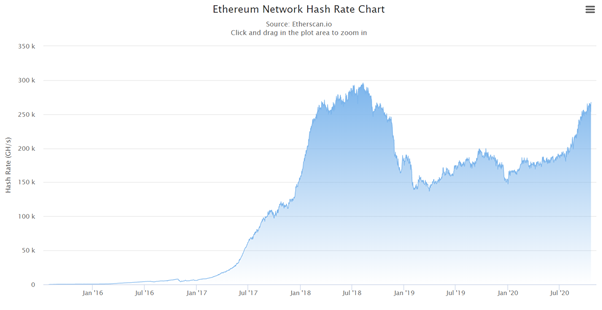
source
The ETH hash rate has been growing lately and its close to its ATH. It is at a level of 267k GH/s. Closing on those 300k.
Daily Transactions
The activity on the network is mostly represented by the number of daily transactions.
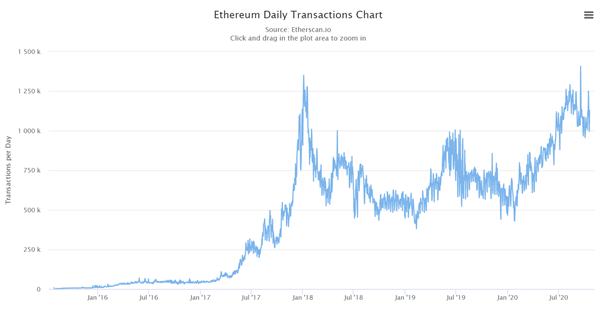
source
Having in mind the ETH fees these transactions can be costly at times.
As we can see Ethereum has broken its ATH in number of transactions. On September 17, 2020 there was 1.4M transactions per day, breaking the previous record from January 4th, 2018 of 1.35M transactions per day.
ETH Gas and fees
Ethereum fees can be quite itimadating. Here some charts on them.
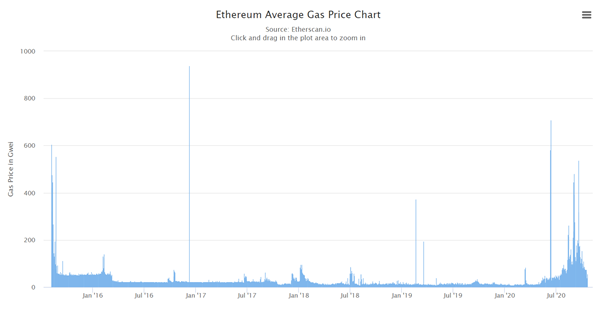
source
We can notice the significant increase in the gas price in the last months. This comes with the increase activities and the DeFi boom. Starting from June 2020 the gas price has been going up, reaching more than 600 gwei on occasions.
Next the daily fees in ETH.
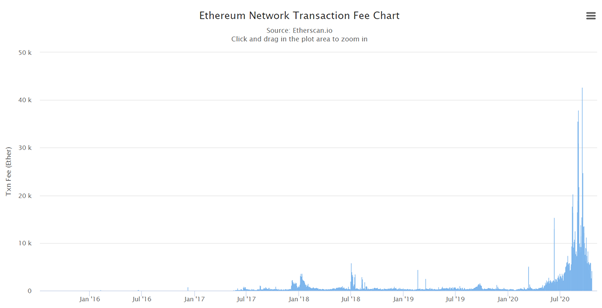
source
The fees are following the gas price and on September 17 they have reached a massive 42.7k ETH (~1$5M) per day. This was also the day with the ATH in activity.
Verified Contracts
Ethereum is a smart contract blockchain. Here is the chart for verified contracts.
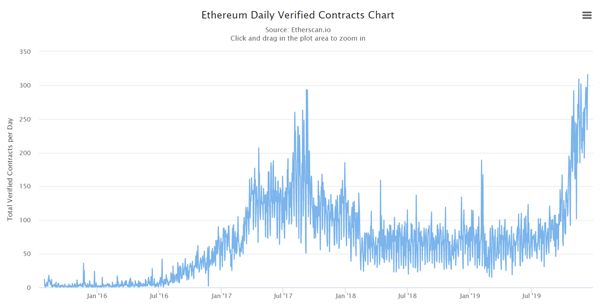
source
The number of verified contracts has grown almost exponentialy in the last months. Even higher growth than the 2017 bull run. This is all due to the DeFi movement.
Ethereum stored on exchanges
Another interesting metric is Ethereum stored on exchanges. It shows do users tend to withdraw or keep their ETH on exhanges.
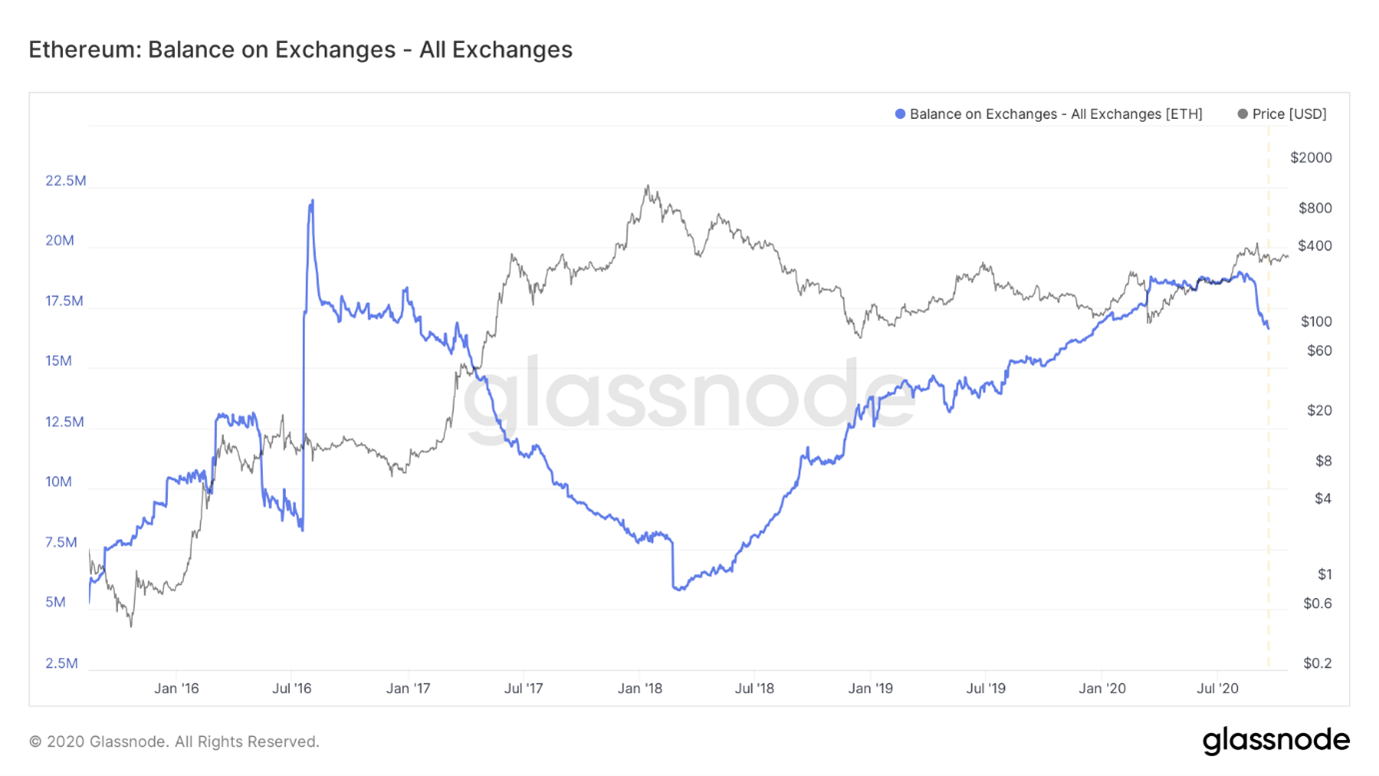
source
As we can see the amount of Ethereum stored on exchanges has been growing steadily since 2018, but in the last months, starting from August it has dropped from almost 19M ETH to a 16.6M ETH on exchanges. This seems to corelated with the increasing popularity of DEXs like Uniswap, where users can deposit ETH in liquidity pools and earn fees from trading. Will be interesting to see will this trend continue in the future.
Overall Ethereum has been showing quite a strong movements in the last months on almost all metrics. The number of addresses keeps growing and some key metrics reached another record. Like the number of transactions and contracts verified. The hash rate has been growing as well, close to the ATH high but still hasn’t broke that record. Although looking at the trend it will probably happen soon. It will be interesting to watch these metrics ones ETH goes hybrid proof of stake.
All the best
@dalz
Posted Using LeoFinance Beta
https://twitter.com/Dalz19631657/status/1318683915285037056
Ethereum is kicking ass, that is for sure. Of course, what I find interesting is how few are talking about the never ending fork that will update the chain and move it to PoS.
Maybe this shows that forks arent the easiest thing in the world.
As for the stats, now we need to get Hive up to match what Ethereum is producing. 😁
Posted Using LeoFinance Beta
Yep, it has been goring a lot in the past months.
As for the stats, 500k active users is not impossible :)
Posted Using LeoFinance Beta
If Leofinance can get to 40K, I think it is a done deal to hit 500K.
Often it takes just one breakthrough to show others it can be done, just like with the run up in LEO pricing. Most thought all HE tokens were worthless and LEO proved them wrong.
Posted Using LeoFinance Beta
Ethereum is kicking ass, that is for sure. Of course, what I find interesting is how few are talking about the never ending fork that will update the chain and move it to PoS.
Maybe this shows that forks arent the easiest thing in the world.
As for the stats, now we need to get Hive up to match what Ethereum is producing. 😁
Posted Using LeoFinance Beta
I think the only pressing problems Ethereum blockchain have is the high gas fees and its inability to handle traffic. I hope ETH 2.0 solves these issues
Posted Using LeoFinance Beta
Interesting as always,
Do you know what the long term supply rate is going to be for ETH - like for Hive it's what around 8% per annum by now and decreasing over 20 years until it hits 1% and then it stays there.
What is it for ETH?
I don't really have any idea!
Posted Using LeoFinance Beta
Actually ETH inflation is a bit special, at least from what I know.
At first it was envisaged like a fixed amount of tokens, lets 10M each year. Not a %.
What this means as the supply grows in time the % should drop.
Later there was some changes, constantinople fork etc... At the moment the inflation is somewhere around 4% to 5%, and it should continue to decrease in terms of %. In terms of absolute ETH, its seems to be around 5M per year.
It doesn't sound THAT different to Hive then! ATM
Posted Using LeoFinance Beta