Soportes y Resistencias || Supports and Resistances.
Que tal mis amigos amantes del trading, espero que mi post anterior al igual que todos haya sido de su agrados y pues espero que le saquen el mejor de los provechos. Bueno puesto a todo eso hoy les traigo un tema básico pero de gran importancia ya que todo es necesario para hacer un análisis técnico para operar en el mercado.
Este tema es sumamente importantes, como ya les dije ya que los soportes y resistencia no son parte fundamental que se tiene manejar sin importar el activo con el que se trabaje.
Los soportes o suelos y las resistencias o techos, forman parte del análisis técnico y de la acción del precio.
# La resistencia o techo es lo contrario a un soporte. Es el punto o pico más alto del precio que ha registrado la gráfica mientras a habido una tendencia alcista actuando asi los vendedores para ponerle fín a dicha tendencia.
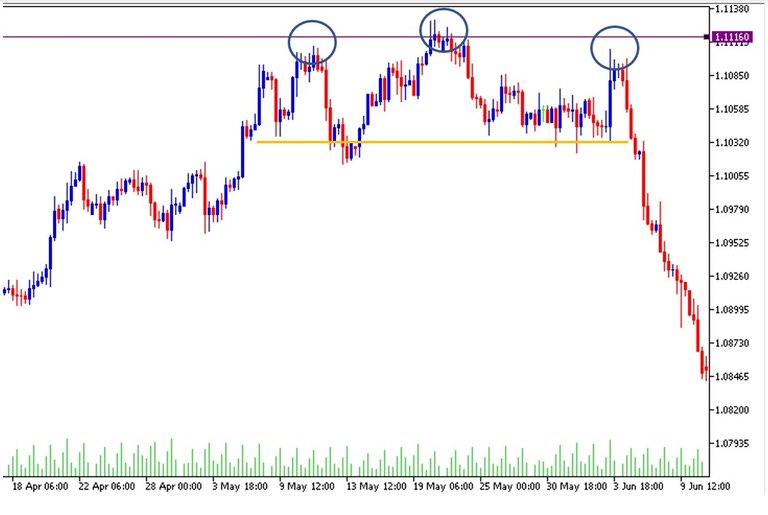
Se puede observa en la imagen como el precio choca varias veces y no puede seguir subiendo por lo cuál identificamos esa zona como resistencia o techo.
# El soporte o suelo es lo contrario de una resistencia. Éste es el punto mas bajo que marca el precio de una tendencia en la gráfica haciendo así una especie de suelo o soporte que es en donde el precio ya no puede bajar más de allí.
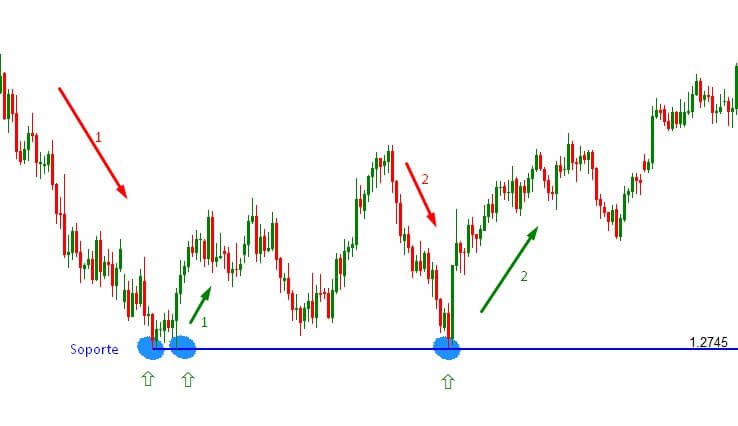
Como se puede apreciar en la imagen el precio cae de tal manera hasta no poder más, entrando así en rango y esto es aprovechado por los compradores los cuales actúan y elevan el precio.
Los soportes y resistencia son usados de gran importancia en los análisis debido a que en ellos podemos observar cuales son los picos que sea producido un retroceso.
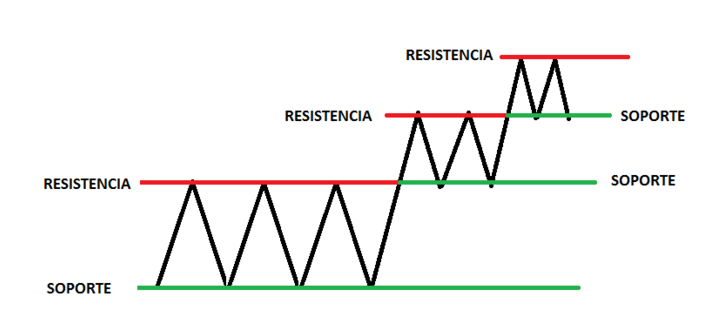
Si observamos la imagen se puede apreciar que las resistencia cambia a la vez a soporte y los soportes a resistencias. Esto ocurre cuando el precio choca varias veces en esa zona y la tiende a romper creando otro pico.
En una tendencia pueden haber varios soportes y resistencias, pero hay soportes y resistencias que el precio choca varias veces y este no puede pasar. a eso se les llama " Zonas Fuertes " que son las cuales tenemos que tomar en cuenta y utilizar para nuestro análisis técnico.
Por favor sigue estos consejos:
1- Analizar la gráfica.
2- Determinar la tendencia.
3- Analizar los patrones de la vela.
4- No operar en contra de la tendencia.
5- dejar las emociones a un lado.
6- Estar en un ambiente confortable o cómodo.
7- No adivinar (no es un juego de azar).
8- Investiga todo lo que puedas.
Nota: Con esto no estoy dando consejos de inversión ya que cada quien es responsable de invertir su dinero, simplemente comparto de mis conocimientos sobre lo que es el trading, ya que existen diferentes aspectos que se deben aprender para comenzar a operar en los diferentes mercados.
Cualquier pregunta, critica o sugerencia estoy abierto para ellos, me pueden dejar en los comentarios sobre que otro temas acerca del trading les gustaria compartir.
Sin mas nada que decir me despido, saludos mi amigos!!
****English****
How are my friends trading lovers, I hope my previous post as well as all have been to your liking and I hope you get the best of the benefits. Well since all that today I bring you a basic but very important topic because everything is necessary to make a technical analysis to operate in the market.
This topic is extremely important, as I said, since the supports and resistance are not a fundamental part that you have to manage regardless of the asset with which you work.
The supports or floors and the resistances or ceilings, are part of the technical analysis and the price action.
# The resistance or ceiling is the opposite of a support. It is the highest point or peak of the price that the chart has registered while there has been an uptrend, thus acting as the sellers to put an end to the uptrend.
You can see in the image how the price crashes several times and can not continue to rise so we identify that area as resistance or ceiling.
# The support or floor is the opposite of resistance. This is the lowest point that marks the price of a trend on the chart thus making a kind of floor or support which is where the price can no longer go down from there.
As you can see in the image the price drops so low that it can't go any further, thus entering a range and this is taken advantage of by buyers who act and drive the price up.
The supports and resistance are used of great importance in the analysis because in them we can observe which are the peaks that are produced a setback.
If you look at the image you can see that resistance changes at the same time to support and supports to resistances. This occurs when the price crashes several times in that area and tends to break it creating another peak.
In a trend there can be several supports and resistances, but there are supports and resistances that the price crashes several times and it can not pass. These are called "Strong Zones" which are the ones we have to take into account and use for our technical analysis.
Please follow these tips:
1- Analyze the chart.
2- Determine the trend.
3- Analyze the candlestick patterns.
4- Do not trade against the trend.
5- Leave emotions aside.
6- Be in a comfortable environment.
7- Don't guess (it is not a game of chance).
8- Do as much research as you can.
Note: With this I am not giving investment advice as everyone is responsible for investing their money, I am simply sharing my knowledge about what is trading, as there are different aspects that must be learned to start trading in different markets.
Any questions, criticisms or suggestions I am open to them, you can leave me in the comments on what other topics about trading you would like to share.
With nothing more to say I say goodbye, greetings my friends!
Posted Using LeoFinance Beta
Congratulations @gpwar! You have completed the following achievement on the Hive blockchain and have been rewarded with new badge(s):
Your next target is to reach 60 posts.
You can view your badges on your board and compare yourself to others in the Ranking
If you no longer want to receive notifications, reply to this comment with the word
STOPTo support your work, I also upvoted your post!
Check out the last post from @hivebuzz:
Support the HiveBuzz project. Vote for our proposal!
Based on the pattern of the first chart I would have to say it is long over due for an upswing in price.