Is that a Inverse Head and Shoulder Pattern I see brewing?
BTC looks like it could have created a nice little inverse head and shoulder pattern
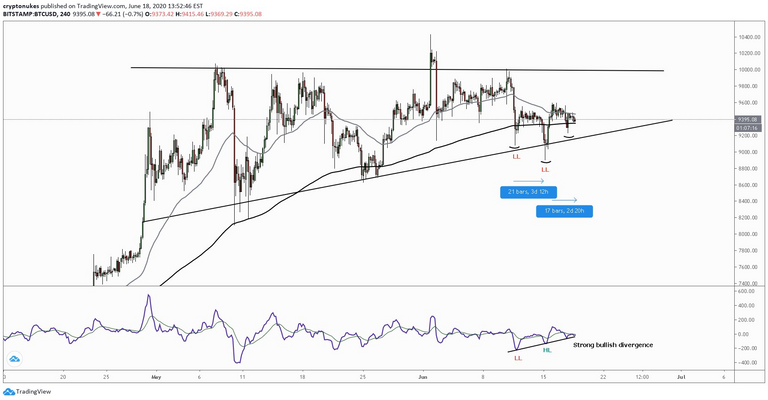
The 240 chart looks like we have an inverse head and shoulder pattern on BTC.
This is normally a pretty bullish chart.
Do you see it?
(Source: https://twitter.com/dekutrades/status/1273691026398547969/photo/1)
The measured move from there would take the price back up near $10k.
I don't have high conviction with this setup by itself, but it is within a large ascending triangle, which keeps making higher lows.
When combined the bullish patterns may just help push BTC through that $10k resistance level in the coming weeks.
It may need to happen soon though because May and June have often been the best time of the year for Crypto.
Posted Using LeoFinance
0
0
0.000
0 comments