The most important chart in Crypto right now...
If anyone asks you why Bitcoin is going up lately, just show them one simple chart...
The price of bitcoin is really all about supply and demand. Technically the price of most things is determined by supply and demand, well besides taxes, subsidies, tariffs etc etc etc.
Anyways, the supply and demand dynamics are so apparent with bitcoin because the supply is always known. The rate of new supply is known and the existing supply is known, though the actual float is somewhat of a mystery due to lost keys etc.
Which means, the biggest influencer on the price is simply changes in demand.
As demand goes up, the price soars, when it drops, the price falls.
While it is hard to measure demand without using a price chart, we can certainly see when the right environment is there for demand to send the price soaring.
Which is exactly what we have been seeing for months now.
Check this out:
(Source: https://twitter.com/n3ocortex/status/1358434279651434502/photo/1)
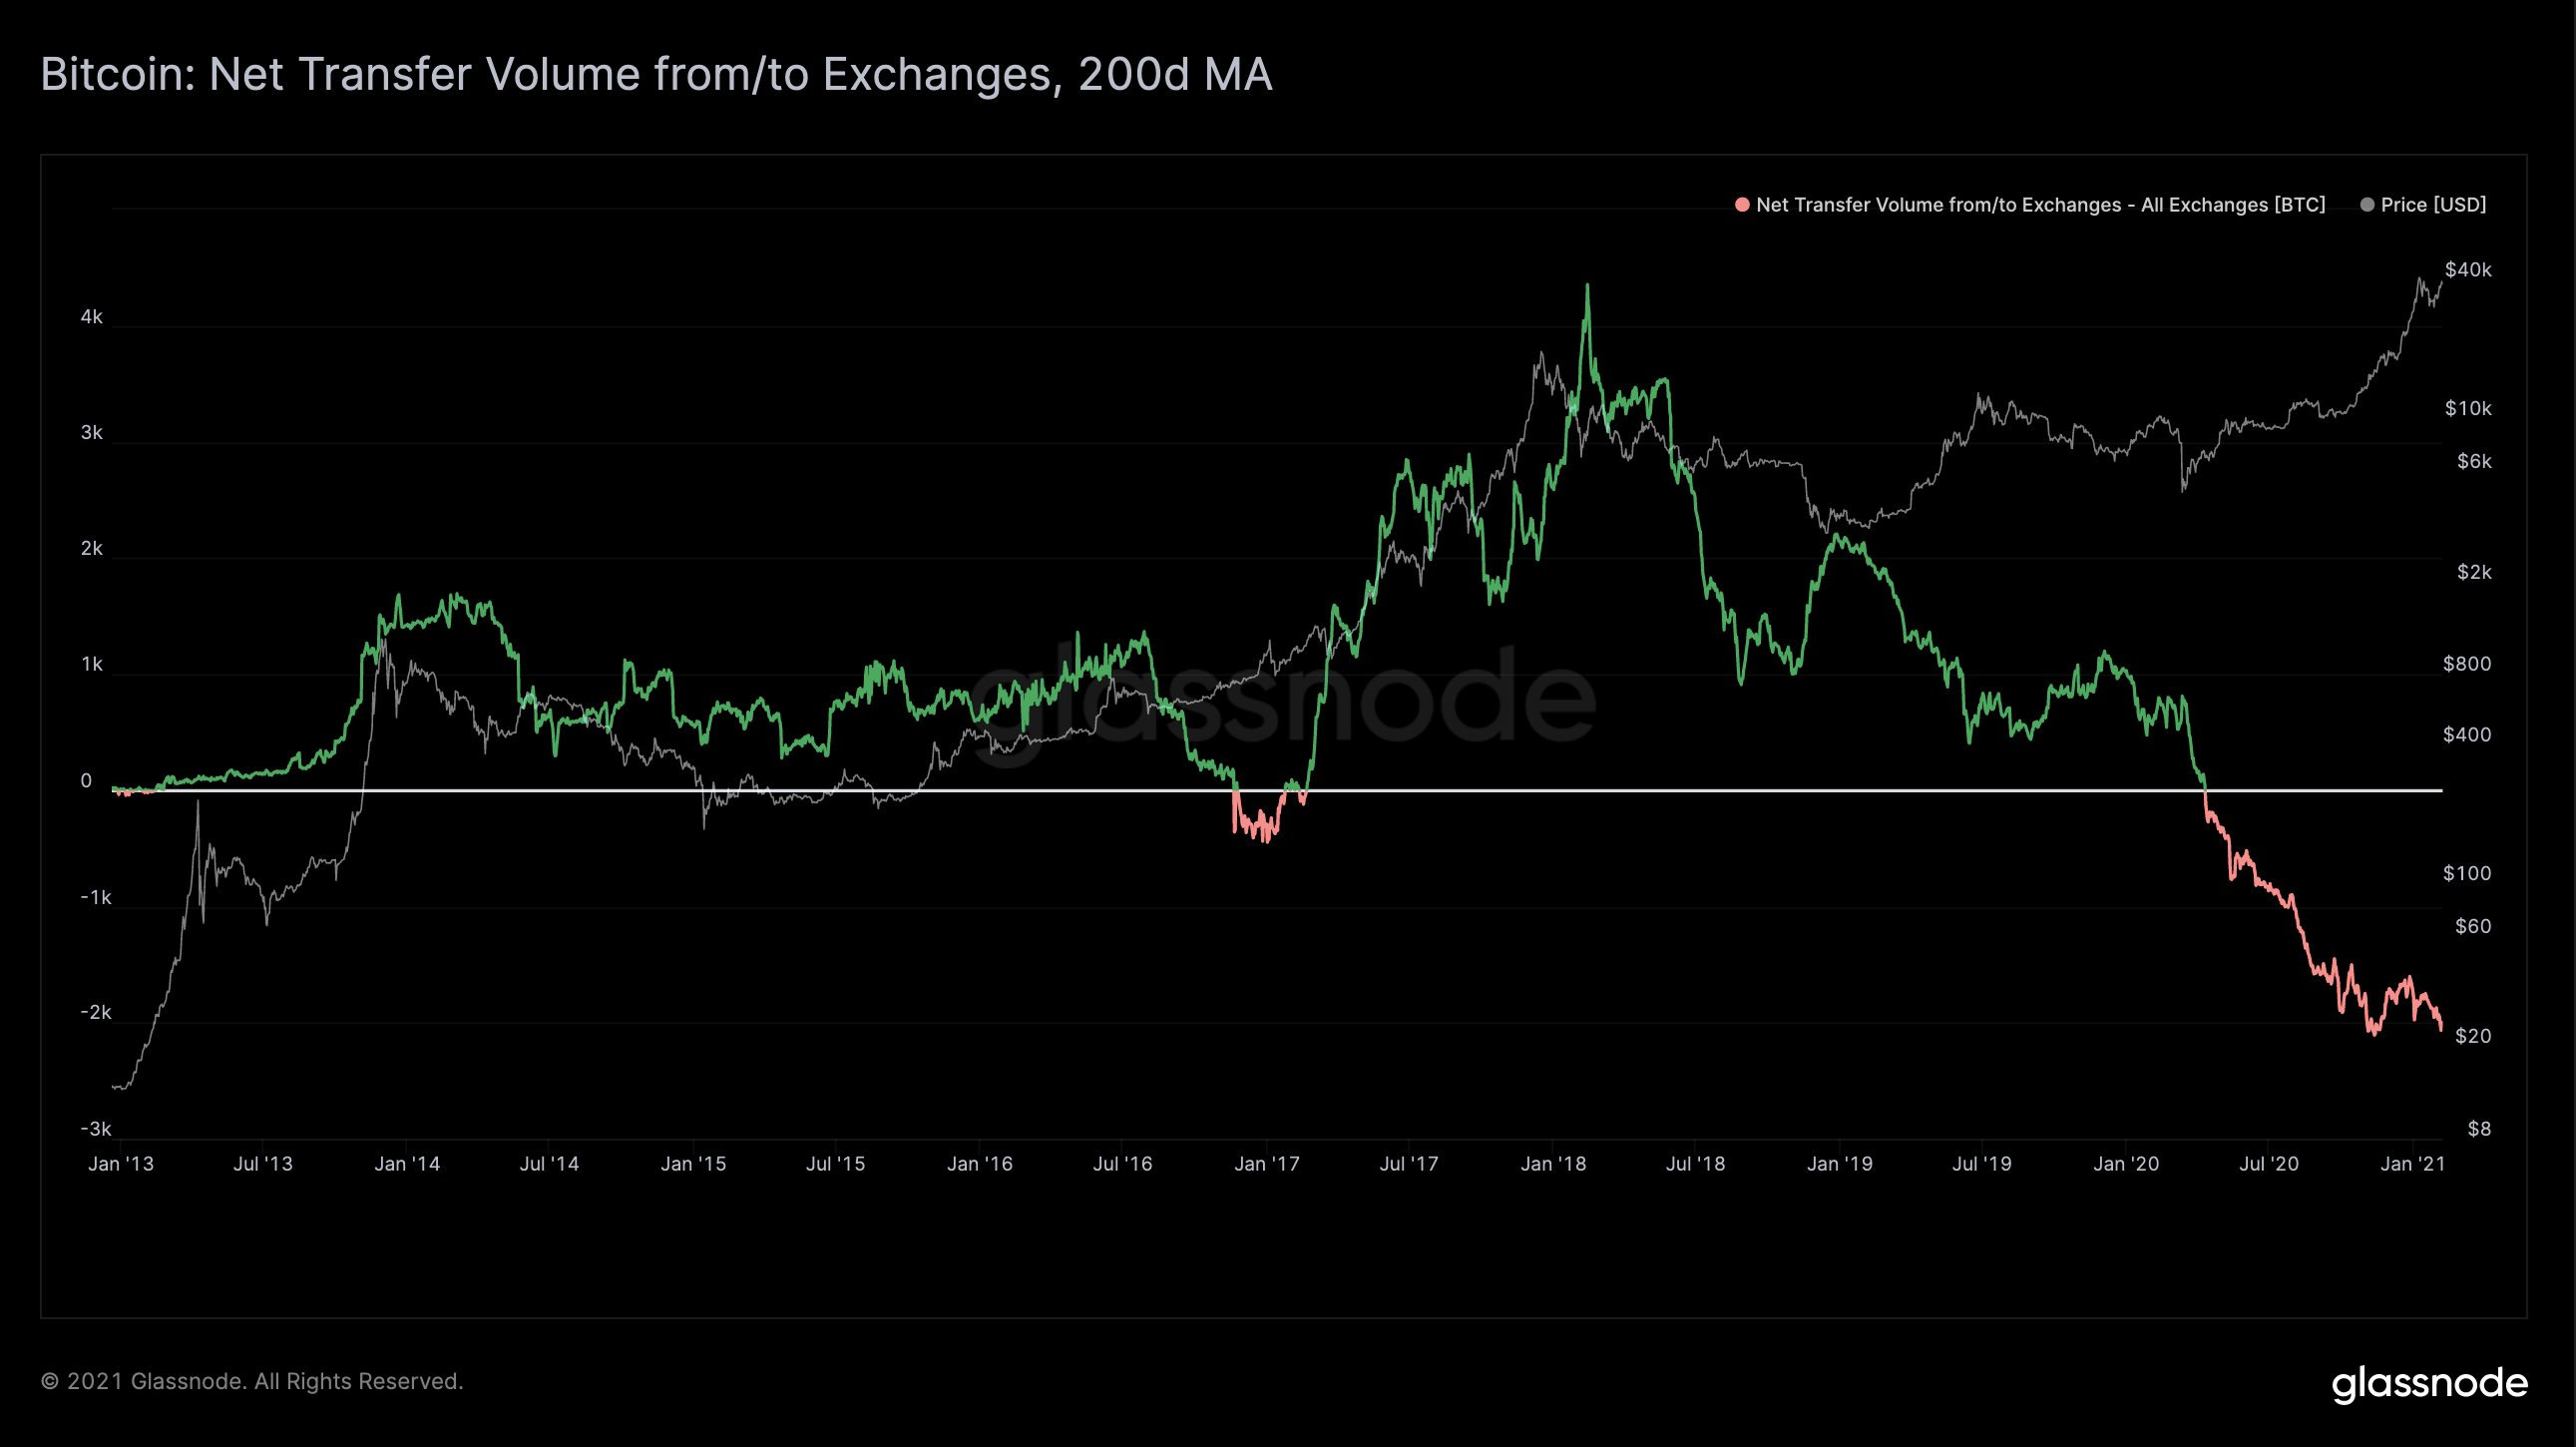
This is a chart of the bitcoin supply sitting on exchanges mapped out using a 200 day moving average.
As you can see, the supply on exchanges has been falling and falling and falling...
What does this mean?
As I stated above, this is probably the most important chart in bitcoin and crypto right now and the easiest and simplest explanation for why bitcoin is going up.
More demand is coming in than there is supply on exchanges to counter the demand.
The neat thing about this is that as the price of bitcoin climbs higher, the supply on exchanges is dropping at an ever faster clip.
The line is starting to slope steeply down at this point, which again is interesting with the prices at all time highs.
One might think that with prices at these levels people would be in a hurry to send their bitcoin to exchanges and sell them.
However, the exact opposite is happening.
The higher the price goes the more people are snatching up the bitcoin on exchanges and moving them to cold storage.
This likely has to do with Michael Saylor others like him buying large amounts of bitcoin on exchanges and socking them away for years.
Also, it may have something to do with upcoming regulatory changes where US based users may have to disclose any transfers to self hosted wallet in excess of $3k.
The jury is still out on whether that will actually go into effect, but it's out there never the less.
Until this trend starts to reverse, the price of bitcoin is likely to keep climbing higher.
Stay informed my friends.
-Doc
Posted Using LeoFinance Beta
Indeed, it's a good chart. I think a good reason for some of the movement is as you mentioned:
So the left scale means that about 2000 Bitcoins were removed from the exchanges in the last year? If this is so, then relatively speaking this would not be sooo much... but it's definitely better than the other way around.
Do you think the bitcoin fractal is now broken? What about eth with that dip yesterday?
no it's not broken as of now (rather than having said that 38k is max, I should have stated that it can't rise above the maximum of 41950 from some weeks back; if it does then it will be "broken"). But as we can see we had a max of 40955 and since then the correction is ongoing. There might be a double peak to ~40.2k before heading back down. If it does not, then 50k is coming up real fast, but that would go against years of repeating patterns, so I think this scenario is very unlikely.
ETH has definitely underperformed, but there is a good chance of it going to 18k in the next days. But it seems that it won't go the moon as fast as I expected (4-5k).
the fractal is broken!
Yes, thank you Elon!
to be honest, I'm not sure if this is actually good as we could now be a half a year ahead of schedule which would also mean that the peak of the bull cycle could be much sooner...
I don't when you expect the top to be but I expect it to be in September for bitcoin, and maybe November or December for alts.
This bull run is shorter yes.
on second thought, it remains to be seen if it breaks out of the strong resistance (the upper orange line in my posts). I still think that a continued correction could happen as price currently is just too steep.
It's actually not shorter. Bitcoin peaked 17 months post halving in 2017. If it does the same this time around, it would peak in October, around when you are mentioned. It peaked only 12 months post halving back in 2013...
It depends how you look at it. Some people believe four year cycles repeat so if it peaked in December last time, it's going to peak in December again. Others count time from the halving. Others count time from the market bottom.
What I do is count from the halving. The number of days from bottom to halving is always close to the number of days from halving to top. I think it will happen again.
They don't repeat based on time of the year, they repeat based on time from halving. That's the cycle.
We aren't half a year ahead of anything. The writing has been on the wall in a number of posts I have posted. We are pretty much exactly where we should be.
These guys and their doubting ways... we were all over the consolidation and following breakout from the beginning. High five!
Correct, but it's happening at a time when the price is at all time highs. Which is opposite of how you would expect these flows to play out...
https://twitter.com/Mistakili/status/1358726747856977921
Hmm, I knew they were talking about disclosures of transfers, but I didn't realize the amount was going to be that high. Since I am a relatively small fish, that might not impact me as much as I thought it was going to. I moved the majority of my satoshis to cold storage a couple of weeks ago. I still have a tiny bit liquid on a mobile wallet. The numbers in that chart are definitely not something I was expecting to see. I mean now obviously, but if you had shown me that a year ago and said this is what it will look like in a year, I would have probably laughed.
Posted Using LeoFinance Beta