TA the easy way – Fibonacci retracement tools of the trade
Welcome to another edition of TA the easy way, and I must say that bitcoin is outmanoeuvring me at every breakout. Constantly breaking up even though I am trying to see it going down. This is just my bearish bias overriding my analysis. I’m sure I’m not the only one expecting the retrace after this parabolic pump. Bitcoin has recently rocketed to the moon since it left the launchpad at $19500.
Even the recent dip of close to 10% was bought up so rapidly that it hardly turned heads. Here we are calling for the 30% to 40% retrace after such momentous bullish buying pressure, and yet we still see bitcoin climb. Obviously those whale institutions are scooping up all the bitcoin like plankton by the million, leaving us retailers with not even scraps.
I have been repeatedly humbled by bitcoin’s performance. Obviously the rules of TA change, depending on the overall trend of the market. Since we are in one of the most bullish trends I have ever seen for bitcoin, my attempt at TA is being “outbulled”, if I can invent a word quickly. The 13 MA line on the 4 hour chart is continuing to be respected, also dropping to coincide with the 21 MA today.
At this rate I can only observe the ongoing uptrend and watch it play itself out. Sometimes trading is like fishing. You sit and wait for something to come along, but you simply don’t know if or when it will come your way. And sometimes you spend the whole day without any luck. That’s how it feels to me, waiting for the bitcoin retrace or pullback. Maybe I’m in the wrong pool. I should be going long in this bullish phase.
Anyway, since this is new territory, and we are beyond any ATH, I am claiming that I am a stranger in a strange land, looking at the chart of bitcoin as if it is a map of the territory. And the map is telling me things, showing me signals and direction, but still I am floundering because of my bearish bias in the bullish terrain. Going long now at this peak of the parabolic pump is just too dangerous for me. Yet that is where the profit lies.
I’m sure that more expert traders are making some short term profits off the current bullish momentum. But I wonder how many buy orders are waiting down at lower prices for their order to be filled? Like me, they are watching bitcoin sail off to the moon while we feel as if we have missed the boat. To my fellow bears, I would say, be patient and know that the tide will turn. FOMO in now, if you like, and try to make a quick scalp but know that the risk is higher than usual.
Unless you have lots of indicators, like the Volume Profile, you may be reading the charts without sufficient data. The volume profile is on tradingview.com which all traders use. However, it is for premium members only, who pay for that facility. I am a humble freelancer – someone who likes things for free hehehe – so do not have the luxury of the Volume Profile indicator. I have seen it used though, and it shows buys and sells lined up around price, and gives us an idea of where support or resistance may lie from that buy and sell pressure. Another place to see it is in “depth” on some exchanges.
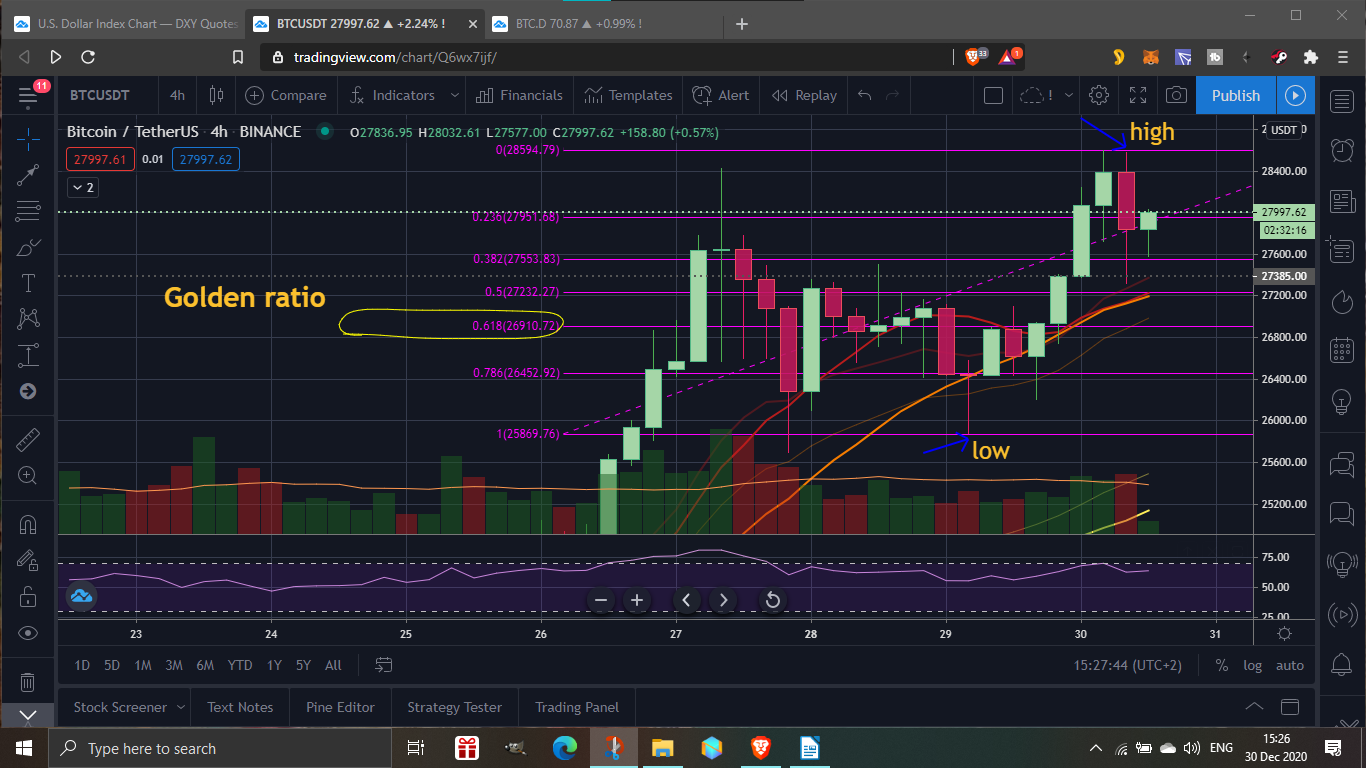
In today’s chart I have used the Fib retracement tool, drawing it from the last swing low made yesterday, up to the last swing high (ATH) made today. The possible retracement points are listed, and the favorite is the 0.618 level known as the golden ratio or golden mean. In theory price likes to return to this point before making the next leg up. The other levels are also options, but the 0.618 retrace would take price to $26911 in the Binance BTC/USDT chart. Remember that each chart and exchange has a slightly different and personalized price level for BTC.
Price has already retraced back to just shy the 0.5 or 50% level (by 0.3%) on this particular move. I cannot say for certain if price will dip lower to meet the 0.618 level. That could be the bounce already, only to the 0.5 level, since bulls are in such a buying mood. As you can see, we have all the signs and indicators, but we still need to know how to use and read them. And we need to consider sentiment, which is massively bullish now.
If you have any other indicators that you like using and recommend, then please mention them in the comments so that we can all learn. Naturally the Fibonacci Retracement tool is a favorite. And that is available for everyone doing TA on tradingview.com or even on some exchanges, that also use tradingview charts.
This is all my personal opinion as an amateur and not investment advice.
Posted Using LeoFinance Beta