Crypto Analysis | BTC and MACD Index
Good day Hiveians!
Join me in analyzing the crypto markets!
In a last post we argued that BTC has a fairly high probability to hit price levels between 7-9k again.
So far we are still on track for this price range with BTC being very stagnant in recent weeks. Often this signals a correction downwards from my experience. But there are many more arguments which we already covered before; e.g. a declining volume which generally signals a correction downwards as well.
Today I want to cover an indicator called MACD which seems to have a very good predictive power. MACD stands for "Moving Average Convergence Divergence". This site defines the MACD as
Moving Average Convergence Divergence (MACD) is a trend-following momentum indicator that shows the relationship between two moving averages of a security’s price. The MACD is calculated by subtracting the 26-period Exponential Moving Average (EMA) from the 12-period EMA.
Moreover:
The result of that calculation is the MACD line. A nine-day EMA of the MACD called the "signal line," is then plotted on top of the MACD line, which can function as a trigger for buy and sell signals. Traders may buy the security when the MACD crosses above its signal line and sell - or short - the security when the MACD crosses below the signal line.
These lines are represented in different colors and can be seen in this chart (at the bottom):
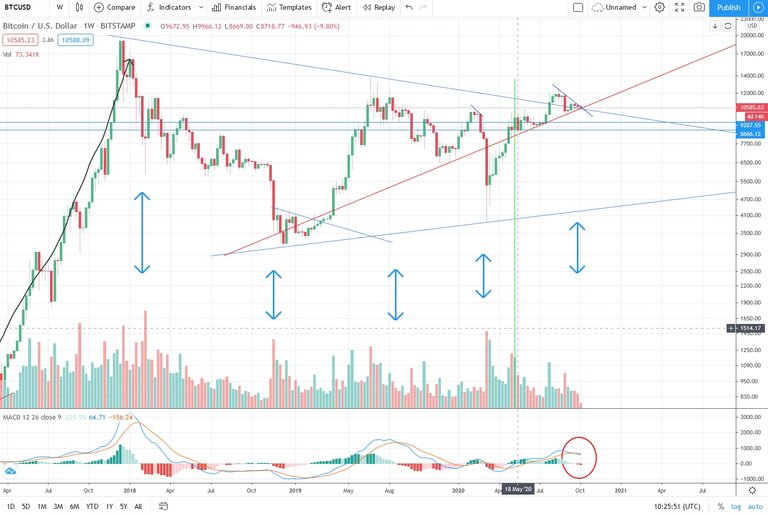
The blue line is the "signal line" which acts as a buy or sell signal. If it dips below the orange line it is a sell signal. On the other hand if it dips above it then it is a buy signal. It is important to notice that the definition identifies this indicator as a trend-following momentum indicator, meaning that the buy or sell signals only become apparent after an (upward or downward) trend has transpired. However, if we look at the chart above we can notice 5 instances (blue arrows) when sell signals (red bars) have happened.
All of these instances (except the current one) entailed a significant price correction for BTC (generally more than 50%!). As you can see we have currently entered the 5th sell signal just barely. The ramifications of this seem therefore rather clear: we could be in of a major price correction in the next weeks/months. However, this trend is not quite confirmed; the sell signal has to continue for the next weeks in order for a correction to transpire with a very high probability.
What does this mean for investors? Personally, I have sold most of my BTC currently as I suspect that we will see a price range between 7k-9k in the mid term. If you are a long term investor, however, you might not get too upset with this potential development as we are very likely already in the next bull phase
As a general reminder: Please keep in mind that none of this is official investment advice! Crypto trading entails a great deal of risk; never spend money that you can't afford to lose!


Check out the Love The Clouds Community if you share the love for clouds!
This post has been manually curated by @sayee from Indiaunited community. Join us on our Discord Server.
Do you know that you can earn a passive income by delegating to @indiaunited. We share 80 % of the curation rewards with the delegators.
Here are some handy links for delegations: 100HP, 250HP, 500HP, 1000HP.
Read our latest announcement post to get more information.
Please contribute to the community by upvoting this comment and posts made by @indiaunited.
Oh! Dear! Not very cheerful news!!
You know what they say, it works until it doesn't. I'm not so sure this time. We might end up seeing it as a dip that should have been bought.
I agree, things do look a bit differently currently. We'll see soon enough :D
Yes, i also think it. You inspired me to share my thoughts, only done 1 this is a follow up 5 month after, I would like to here your thoughts on it? -> https://hive.blog/hive-167922/@digi-me/a-quick-update-on-my-previous-post-bitcoin-hash-ribbons-gave-a-buy-signal-today
Agree, I think that also :)