Macro Analysis of the Dow Jones Index- 7 year bear market ahead?!
Good day Hiveians!
I have been playing around with the chart of the dow jones industrial average index and the macro outlook is pretty crazy
Let's first go back 100 years and have a look at the chart:
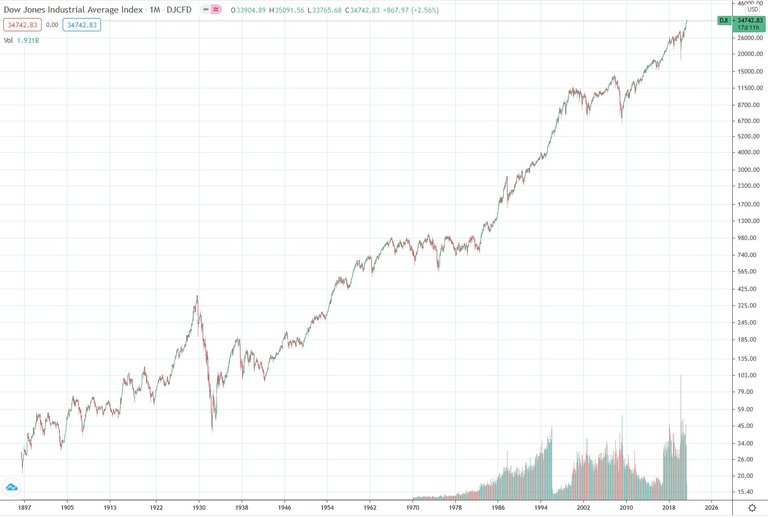
That is one crazy graph. If one were have to invested in 1897 at around 21$ and held until today there would have been a whopping return of 167800%! Say what?! No wonder people say that the best strategy for investing is to buy and hold and basically only sell at the very end... The market has been going up, up and up!
Even with the great depression of 1929 which saw a correction of 90%(!) one would have still made a 100% return from 1897 at the bottom of that crash. So the obvious question is, how will things unfold in the future, especially with the huge market rally over the last 10+ years? Will the market go up, up and up?
An interesting picture emerges when one uses Elliott wave theory and applies it to this chart. We get something like this:
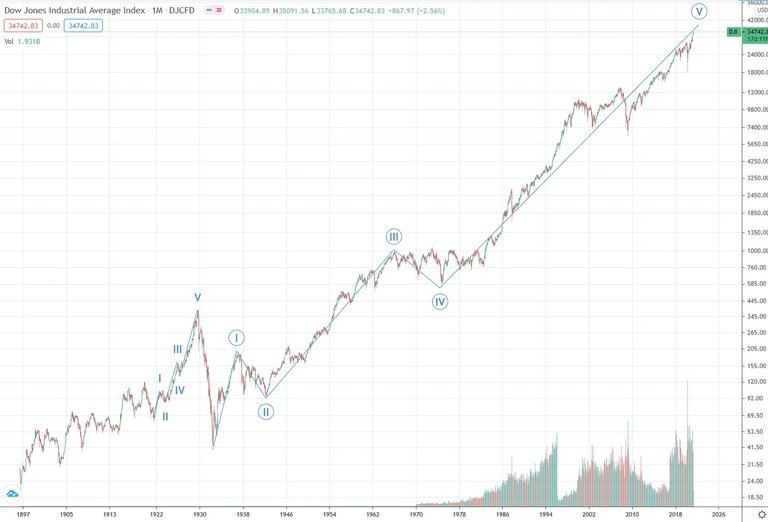
This pattern is very clear. It is pretty much identical to the run up to 1929 seen as I,II,III... notice the distances of these waves in relationship to each other and compare them to the circles I, II, III... This is a huge impulse wave starting from around 1932 all the way up to 2021. Now the obvious question that this chart asks is when does V end? Will there still be decades of upward movement? Extrapolating the current movement we would then get a DJI of about 66k in 2030. While this is of course always a possibility, I don't think the odds of that happening are very high.
Instead, I think this huge upward push might be coming rather sooner than later to end. But for this we have to dive into the chart a bit. This is the last 40 years. We had the dotcom bubble as well as the housing bubble marked with 1 and 2. After that we had the market rally shown in the orange oval. Then we have a repeating fractal starting in 2018 which is marked again with a 1 and 2 . We have a pretty much identical market rally after the corona crash of last year. These shapes are very clearly fractals. Notice also how the market hasn't been able to break the resistance of the V wave and is now just about to test it again.
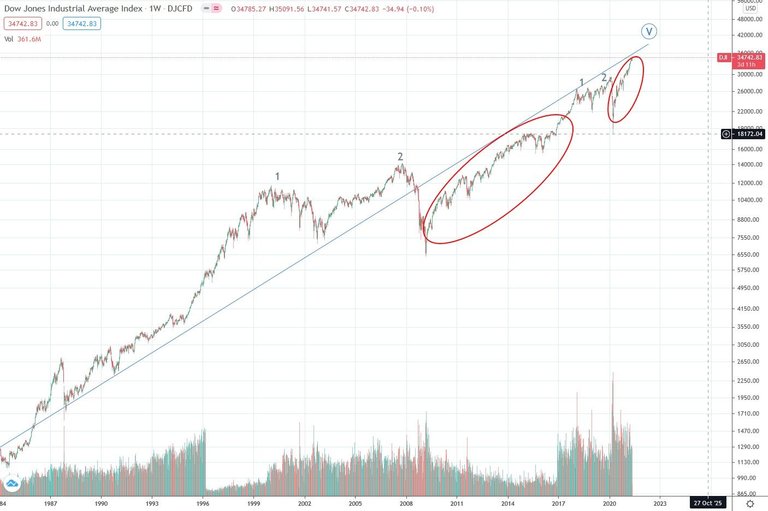
This chart tells me at least two things: (a) there is a strong resistance which the market could not overcome in the last 12 years and (b) the fractal of the "1,2 and rally" has repeated almost exactly in the same way only smaller. Could the fractal therefore have "run out"? And if so, this could be interpreted as the end of wave V as it has then completed its pattern. Fortunately there is an easy way to test this theory. I will make a prediction. The prediction says that the latest rally (shown in the second oval) is going to be followed by an even smaller 1,2 in the next year. Let's have a look:
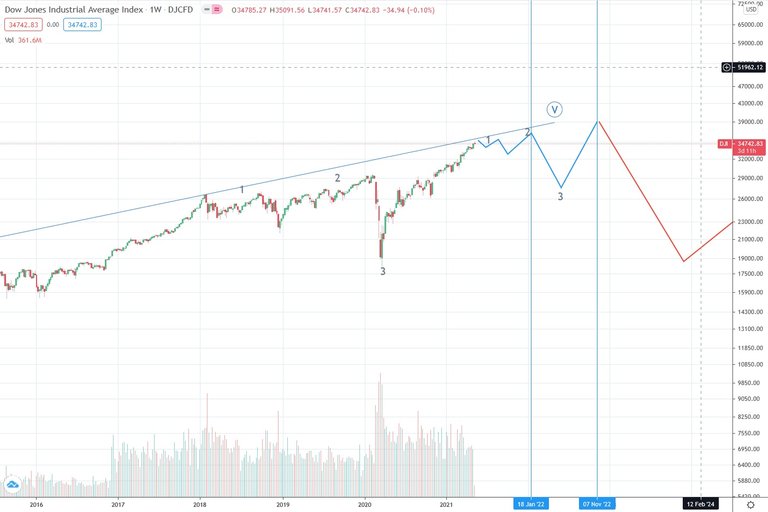
We should have a repetition of 1,2 in the coming months. In other words, there should be a side ways movement in the market. This should then be followed with 3 taking the market back to about 30k. And then this fractal might pay out one last time going to perhaps 39k before entering a possible long term bear market. I want to emphasize the scenarios again. Either (a) the market will breach the resistance line and break out to the top, thereby breaking out of this fractal, or (b) the market will continue this fractal until it has "run out", meaning that wave V has come to an end.
Obviously for (b) to occur there must be some kind of problem with the financial system in the coming year. What could be such a cause? Geopolitically speaking there are unfortunately a lot of powder kegs that could blow up... There could also be another pandemic or another X bubble. Whatever the cause, the (b) scenario would suggest that something would have to trigger this bear market. But perhaps scenario (a) is also not unlikely, which would propel the market to 40k and beyond. But somehow it feels off for the market to just continue upwards even though the macro picture from the beginning showed that the market on average does always move upwards. However, if wave V is about to finish there would be a much bigger correction than what we saw in the last decades. How low could this go?
The chart actually is very clear about how low and until when such a macro correction would carry out.
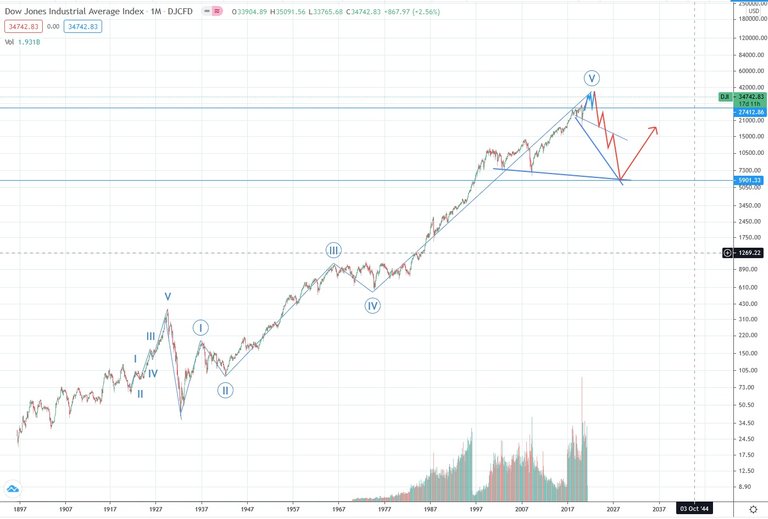
Connecting the lows from the dotcom bubble and the housing bubble crashes as well as the pre corona correction (the correction after 1 in the chart above) and the corona correction itself gives us two trend lines that converge at around 2028. This would give us a low of about 6k and a correction of about 85% from the cycle high. Sounds crazy? Well, yes it does. Such a correction would be no joke. The world would be plunged into 7 years of a global depression (for whatever reason) and the corona year we just experienced would seem like it was the good years... A correction to the trend line above to about 20k seems perhaps more likely, but then this wouldn't be the end of wave V. For wave V to end we would have to see such a grand correction and the fact that this chart aligns so perfectly with these trend lines makes me think that this is a real possibility.
Obviously, nobody should want this (b) scenario. If I think back over the last year, I think it is quite evident how societies change in times of difficulties. Laws are being passed that favor security and surveillance rather than strengthening our rights freedoms. People lose their jobs, and their health decreases etc. etc. While there have also been some good developments, I think the negative ones far outweigh the positive ones.
Let's hope that we can all avoid this and make this world a better place... 🙏
As a general reminder: Please keep in mind that none of this is official investment advice! Crypto trading entails a great deal of risk; never spend money that you can't afford to lose!


Check out the Love The Clouds Community if you share the love for clouds!
Such huge dips are entirely possible even given the fact that central banks have unlimited firepower. The market tanked in March 2020 after all. But how long would such conditions be allowed to continue on the financial markets? Consider the Venezuelan stock market for example. The economy of Venezuela is shit but the stock market isn't bad at all.
Posted Using LeoFinance Beta
yeah, I have a hard time believing that "they" would allow the markets to drop so much for such a long time. Yet it is what the TA suggests. We'll see I guess sooner or later