This post aged rather well (unfortunately)... Stock Crash of 1929 and 2020
Good day Steemians!
Join me in analyzing the crypto markets!
2 months ago (just before the stock market crash) I made a post: "DJI: 1929 and 2020 Similarities Revealed" in which I analyzed the current DJI with the stock market crash of 1929 in which I identified 3 particular waves which I argued could be the indicators of another crash to come.
Let's compare the graphs; these are from the original post:
1929 and 2020 (February)
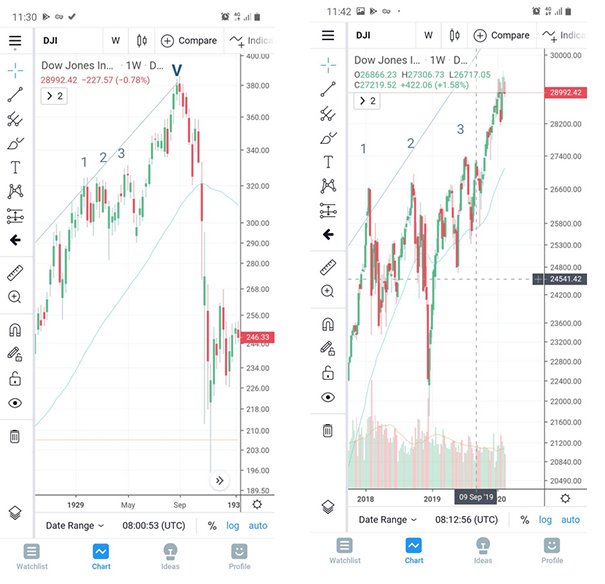
And here we have 1929 and 2020 (April)
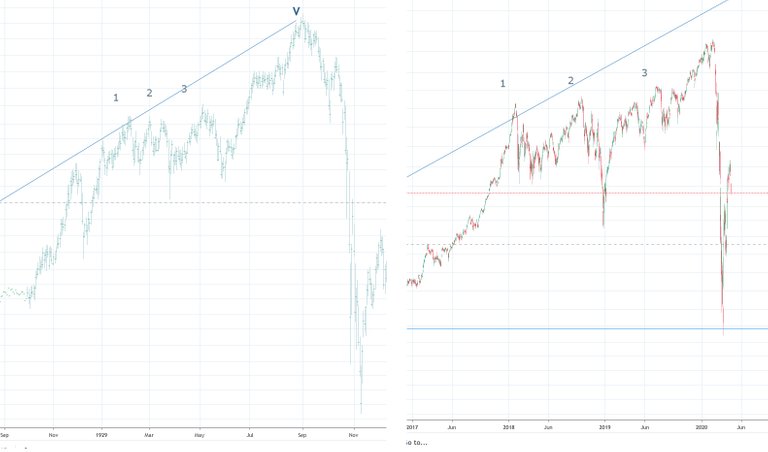
I expected the market to reach up into the 31-32ks before the big plunge, but with the pandemic I guess this all started a bit sooner.
Note that the graphs do not reflect equal losses; the great depression saw losses of more than 80%; the biggest drop currently was "only" about 40%.
If we were to see an equal loss for the current market the DJI should drop into the 5ks and 4ks...
While technical chart analysis should never be the only tool to understand markets, it is often a very useful and often underrated method.
As a general reminder: Please keep in mind that none of this is official investment advice! Crypto trading entails a great deal of risk; never spend money that you can't afford to lose!


Check out the Love The Clouds Community if you share the love for clouds!
intresting. tho I cant say I understand it very well. hard stuff.
there is a lot to learn and a lot that remains unknown ... but the market is always based on repeating patterns
mmm... maybe better to say: patterns can be seen there. but it mght not be the only basement? isnt it a balance of decent amount of diff. factors?
yes of course, but fractals play a very important role. Infact if one looks at all of the possible factors (that's not even possible) one generally gets a very confusing picture because it is just too complex. So in this kind of analysis it is important to keep things as simple as possible.
the key pattern, agree.
https://steempeak.com/hive-148441/@jrcornel/steem-showing-strong-support-in-the-usd-15-usd-16-area
I think you may find it intresting.
looks plausible to me.
what do you think of the analitics?..
the thing is that all of the alt cryptos folow the path of Bitcoin. And I still believe it will head to 4-5k levels; so before that happens I wouldn't be too optimistic. However, as we have seen with hive over the last days there are break outs and surprises. I haven't predicted the dramatic increase and I think it can be largely explained by the listing at Huobi. But I doubt it will be sustainable. However, long term I think most cryptos are looking very strong
Oh! No! There is still some way to go! Down!!