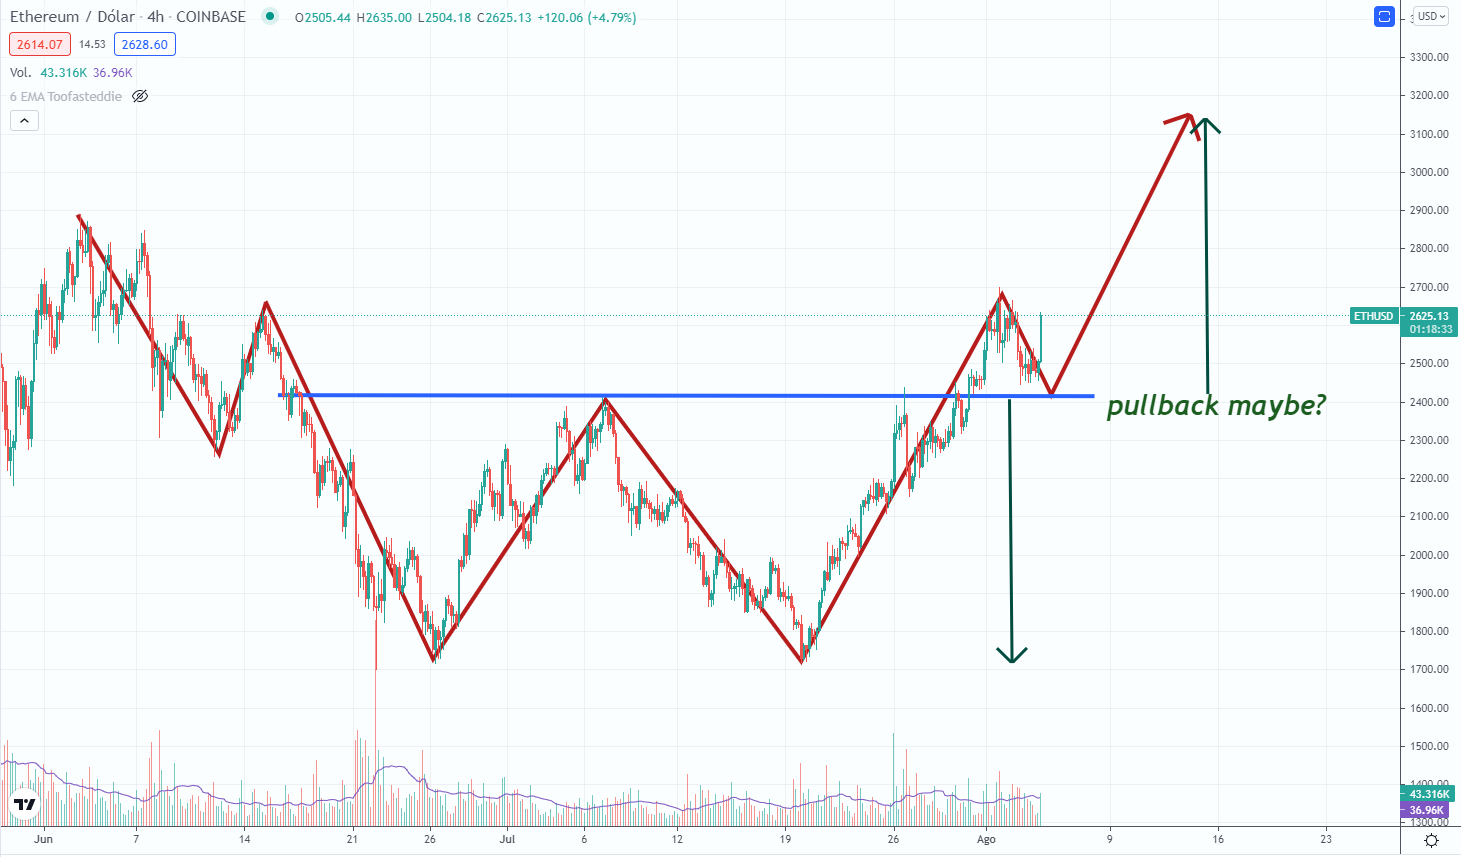
Ethereum's Awesome W Bottom
We already know that patterns are not always fulfilled, although many of them have considerable reliability.
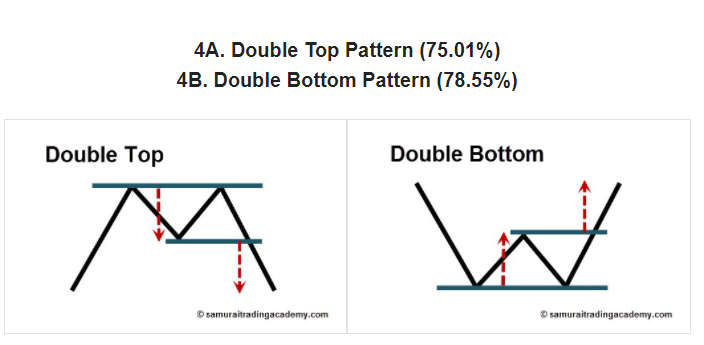
In particular, the one we see in ETH is an impressive almost handbook W-Bottom, also called a double bottom.
According to Samurai Trading Academy, the double bottom is a slightly more effective breakout pattern than the double top, reaching its target 78.55% of the times it appears.
I am a fan of this type of pattern although my conservative brain tells me that I should still wait for the pullback so, I have bought 50% of my investment today in ETH and the other 50% I am going to put it waiting to see if that pullback appears or not finally ( LoL may have already done it)...
Here the question is whether this W-Bottom is finally confirmed as the confirmation of the reversal.
Generally, the pattern is considered a success when price covers the same distance following the breakout as the distance from the double low to the recent swing high in a double bottom... and if so, the confirmation target indicates $3100...
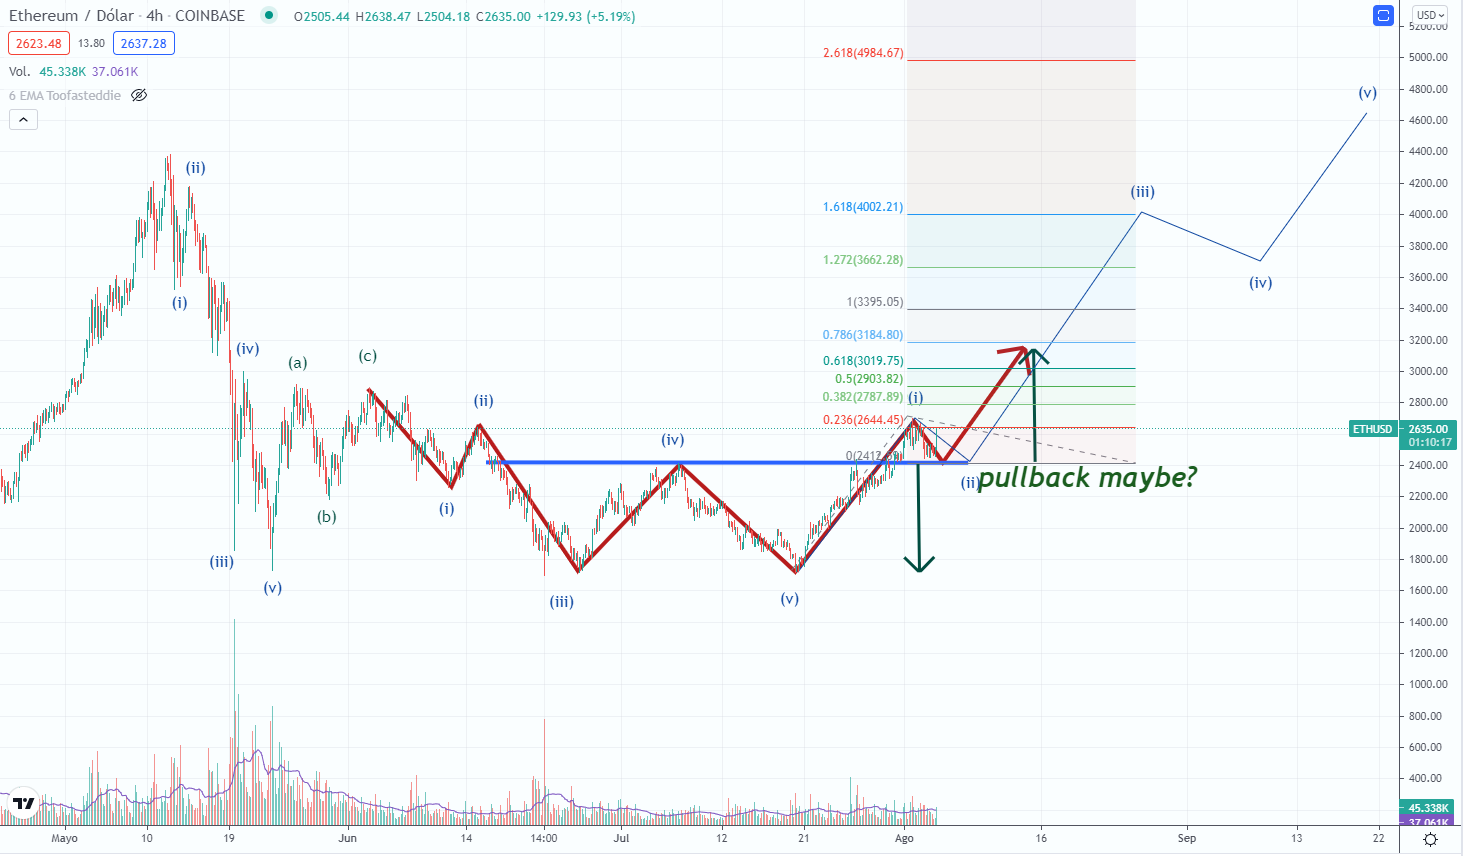
if it keeps going upward, I would not be so surprised to be talking about the first wave of 5 upward impulse waves... In that case, the minimum target of its third wave (1.618 FIBO) would then aim for $4000...
As always, a substantial increase of the volume should accompany the price action.
*Disclaimer: This is just my personal point of view, please, do your own assessment and act consequently. Neither this post nor myself is responsible of any of your profit/losses obtained as a result of this information.
Posted Using LeoFinance Beta
https://twitter.com/thecryptorunner/status/1422936669938933767
The rewards earned on this comment will go directly to the person sharing the post on Twitter as long as they are registered with @poshtoken. Sign up at https://hiveposh.com.
$4,000 by the end of August.
deal
!LUV
@acesontop, you've been given LUV from @toofasteddie.
Check the LUV in your H-E wallet. (1/3)
yes please
send it to $3200 NOW