Is Market ready for Bull Run!!
There are a lot of positive signals here and there, suggesting the possibility that the crypto bear market, which has been going on for about two months mid-April, may be slightly reversed.
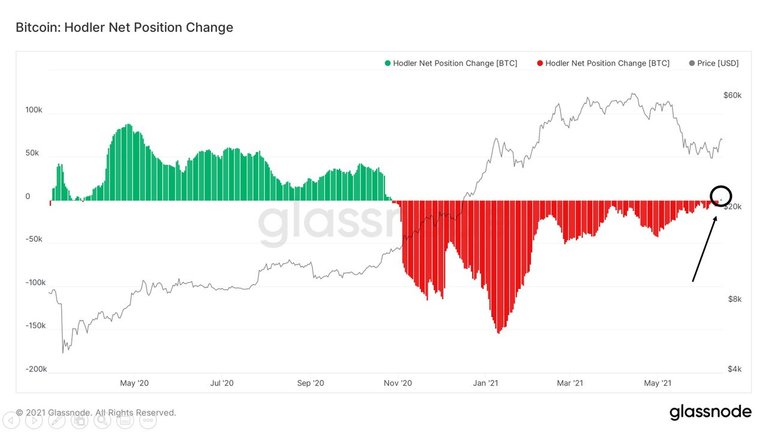
Once we look at Glassnode's Bitcoin Hodler Net Position Change, the change in the net position of Bitcoin Hodler turned to green for the first time in about 10 months since October 2020.
In addition, PlanB, which created the Stock to Flow (S2F) model, predicted in a tweet that a second rally for Bitcoin would soon begin, and responded "So it begins" to a Glassnode chart tweet posted by on-chain metric analyst Will Clemente. I did too.
Those who increased the volume of Bitcoin during 2018-2020 might have managed to weather the decline, but investors who entered the highs in early 2021 may have felt more extreme than they did in early 2018.
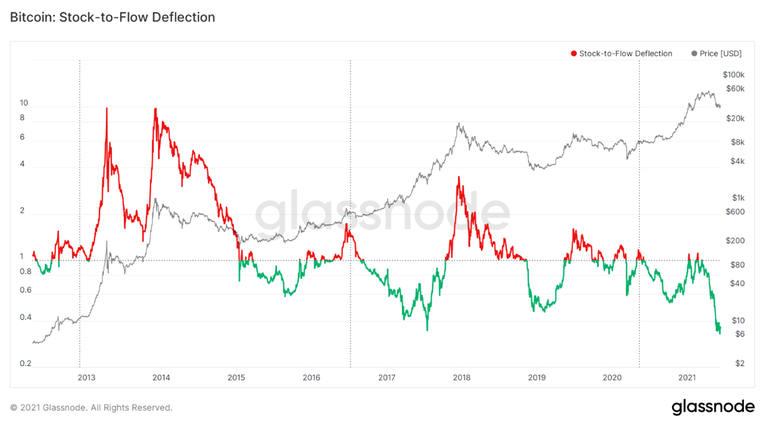
Currently, the S2F model has the largest deviation in history, and at this point, which is located at the bottom of the deflection band, a rebound must occur to achieve a certain degree of data reliability.
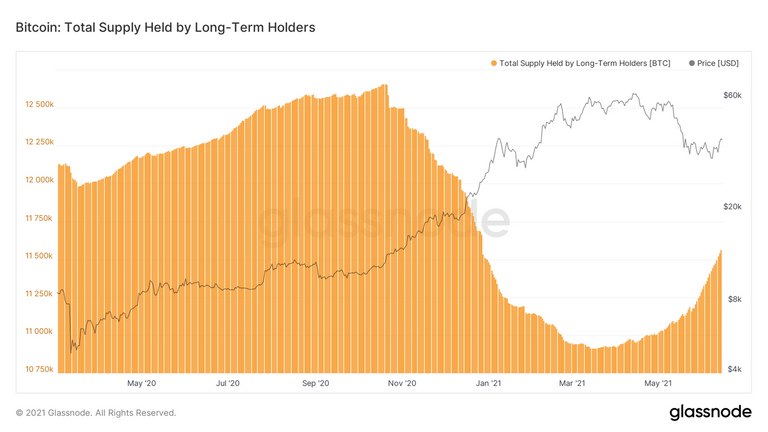
In the case of long-term Bitcoin investors, rather than in March, before the Bitcoin stamped, a large amount was rather cleared up, but from the mid-April decline, they are concentrating on increasing the quantity at a sharply low price.
Glassnode's standard for long-term investors (LTH) and short-term investors (STH) is 155 days, which is 5 months.
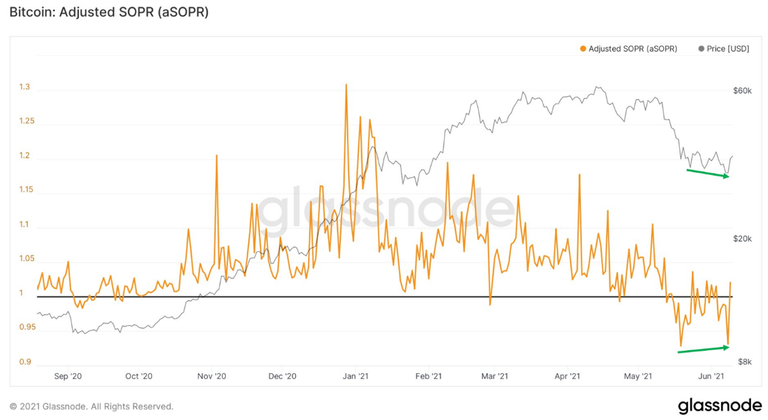
The Adjused SOPR, which can be said to be the profit realization ratio of Bitcoin traded on a daily basis, hit the lowest double bottom since March 2020 and again rose above 1.0, which can be called the threshold, showing a bullish divergence signal.
Fidelity's Jurrien Timmer also made an interesting prediction that the bottom of the technical analysis has been confirmed and the trend will follow.
Images Source: https://glassnode.com/metrics
Thanks for reading! Please share your views in comment section. Do Follow, Upvote and Share. Have a Great Day 🙏
Posted Using LeoFinance Beta
매우 흥미로운 분석이군요.
비트코인이 곧 상승할 것이라는 전망이 점점 강해지는가요?
여러 의견이 존재하는 가운데 정신을 바짝 차려야겠습니다.
Posted Using LeoFinance Beta
Looks like it from your chart!