Bitcoin (BTC / USD) CME: Bitcoin going up or down? - $ 14000 or $ 8900 dollars
The price of Bitcoin at the limit of the bullish channel. Up or Down?
In the previous post of the CME we saw the 2 options, for the price of Bitcoin, the bullish having more possibilities but when breaking the bullish central channel we saw that the price touches the limit of the lower channel again, we will see what implications it has for the price
Let's see
Will analyze the possible target, bullish or correction in the price of Bitcoin, analyzing according to elliot and RSI.
Why analyze Bitcoin by CME?
Following the price of Bitcoin by CME for days has made it easier to predict possible movements up or down
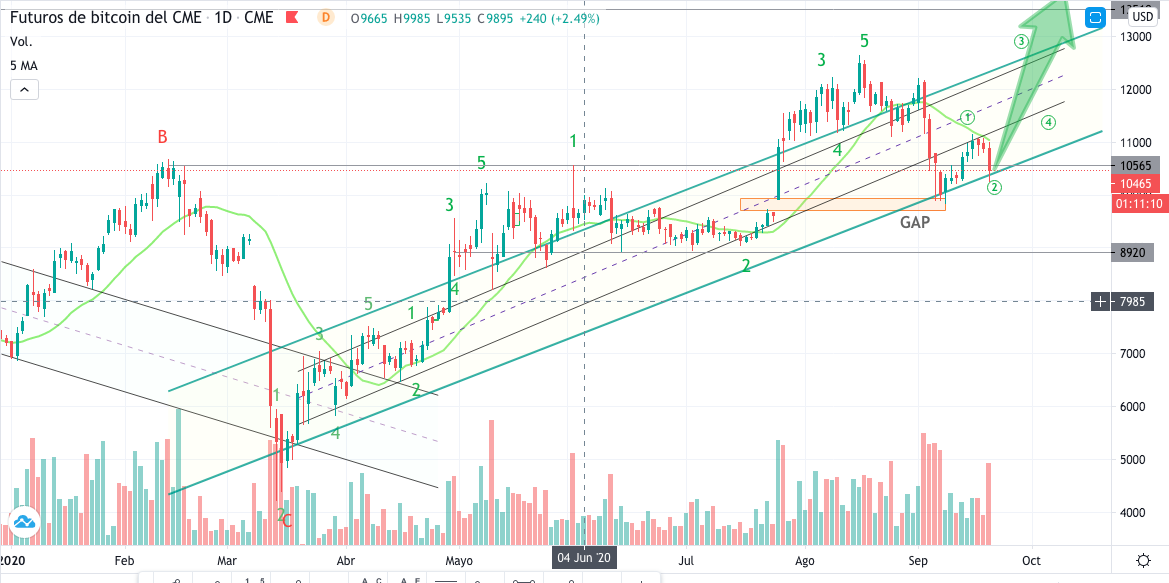
Daily analysis
Analysis of recent months
Analyzing the graph we see that throughout these last months
Bitcoin price has moved through 2 bullish channels, one within the other
The price has gone through a complete cycle of 5 elliot waves and another has started.
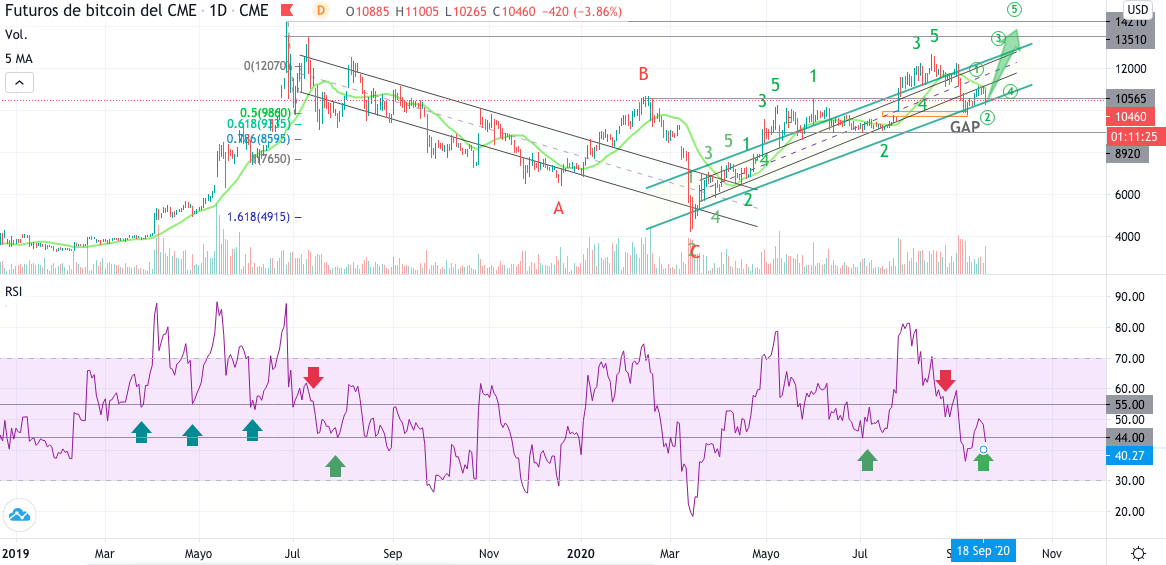
If we review the RSI in the last 3 months we can see how the price, in July, gains 55 RSI points and loses them again. If we compare it with the previous bullish cycle, this value has served as support and only when it was broken has the downward correction cycle started.
Today it loses the 44 points of the RSI again, we will see the consequences in the daily analysis.
Analysis of the last days
The price of Bitcoin in the last few days tries to gain the inner channel, retests the resistance of the 21-period midline which does not break it and the price falls back.
At the time of doing this analysis, the price is retesting the bottom line of the ascending channel.
When analyzing the RSI we see that it has lost 55 points, which would indicate to continue correcting the price and is trying to maintain the 44 points, which has not succeeded in doing this analysis.
Keys
- 4-hour RSI chart shows oversold values (good sign)
- Price is trying to hold 44 RSI points (good sign)
- Price below the average of 21 daily periods (bad signal)
- Price below 55 RSI points (bad sign)
- The lower line of the lower channel is maintained.
Elliot Wave Analysis
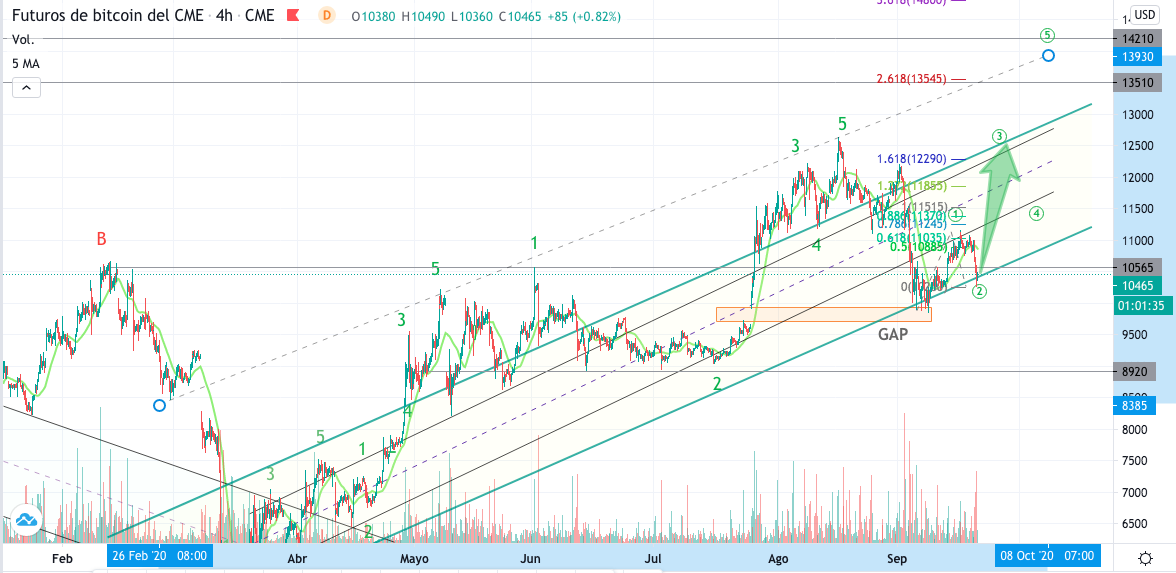
Analyzing with elliot waves that we saw in the previous post, that we are in a new bullish cycle of 5 elliot waves
Where waves 1, 2 could already be formed and wave 3 could begin to form
If we project a fibonacci extension, it indicates that wave 3 could go up to $ 12,500.
Other possibility
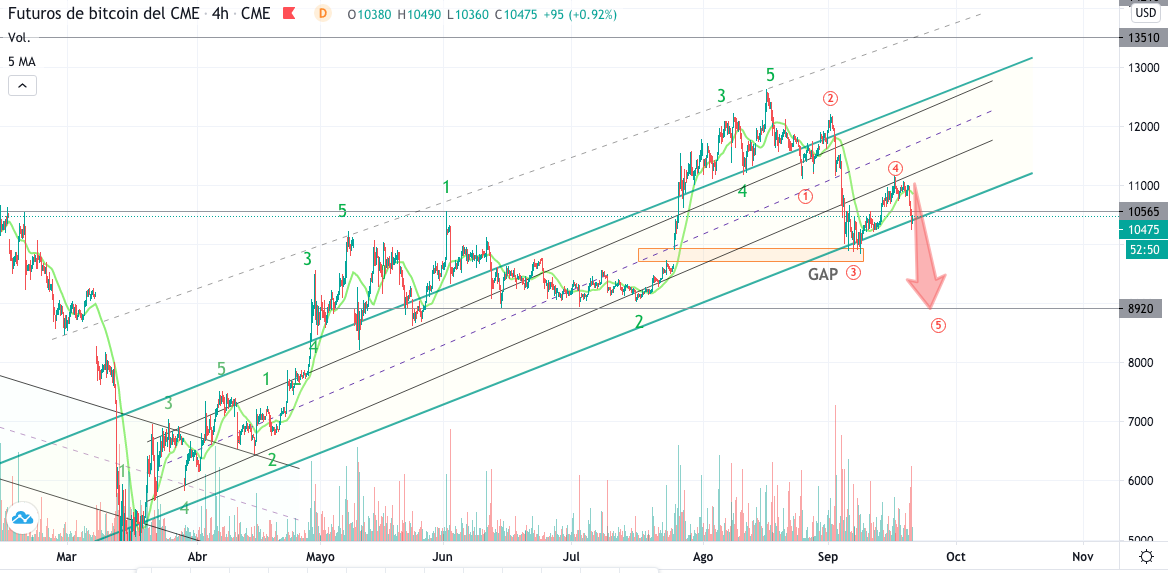
If it continues to correct, it could break the bullish channel, it is another possibility, which we must take into account, the price can continue to correct.
Analyzing with elliot waves it could be forming the first 4 waves and we could estimate a wave 5 up to $ 8900 dollars.
Filling the GAP that is in the $ 9700 dollars.
In conclusion
Breaking the mean line of 21 daily periods is an indicator to take into account.
But the current correction values indicate that it may be indications of the beginning of a new bull cycle (for the price to remain in the bull channel)
Likewise, I leave you the option of continuing to correct the price for you to analyze and comment.
What you think?
Remember to give your post a vote, Always support good content. ThanksFollow me it costs you nothing and you get a Healing Reward with Your Vote

Protect your assets use Stop loss
The alcoins market is very dependent on the price of Bitcoin, when Bitcoins goes up the alcoins go up more, but also in the other sense, so I suggest that you periodically review a Bitcoin and use stop loss and move it when they are already in profit. Do not let a profit become a loss.
We will continue monitoring
To be attentive
Protect your Investments
Feel free to use and share my post or graphics, but please mention, @criptoar as the author. Otherwise, consider plagiarism and I will call you and advise my friends to do the same.
READ DISCLAIMER: this publication / analysis is only for general information purposes. I am not a professional trader and I will never be a financial advisor. The material in this publication does not constitute any trading advice of any kind. This is the way I see the paintings and what my ideas are.
Perform your own analysis before making an investment decision. Use money that you are willing to lose if you make an investment.
If you make exchanges or investments after reading this publication, it is entirely at your own risk. I am not responsible for any of your gains or losses. By reading this publication, you acknowledge and agree that you will never hold me liable for any of your profits or losses.

For your vote or comment, thank you