BTCUSD Analysis 02.05.2020
This is actually my first post on Hive, so, this is me saying “Hello” to the wonderful community on here. Let’s go straight to today’s business which is my analysis on the BTCUSD today.
Tools:
Rectangular Box: Balance Zone
Green Line: Dynamic Support
Looking at the BTCUSD chart today was quite interesting as I focus on other commodities rather than BTCUSD but I plan on doing this for a long time which might mean that my analysis would be on a daily basis. I’ll work on a scheduled posting time.
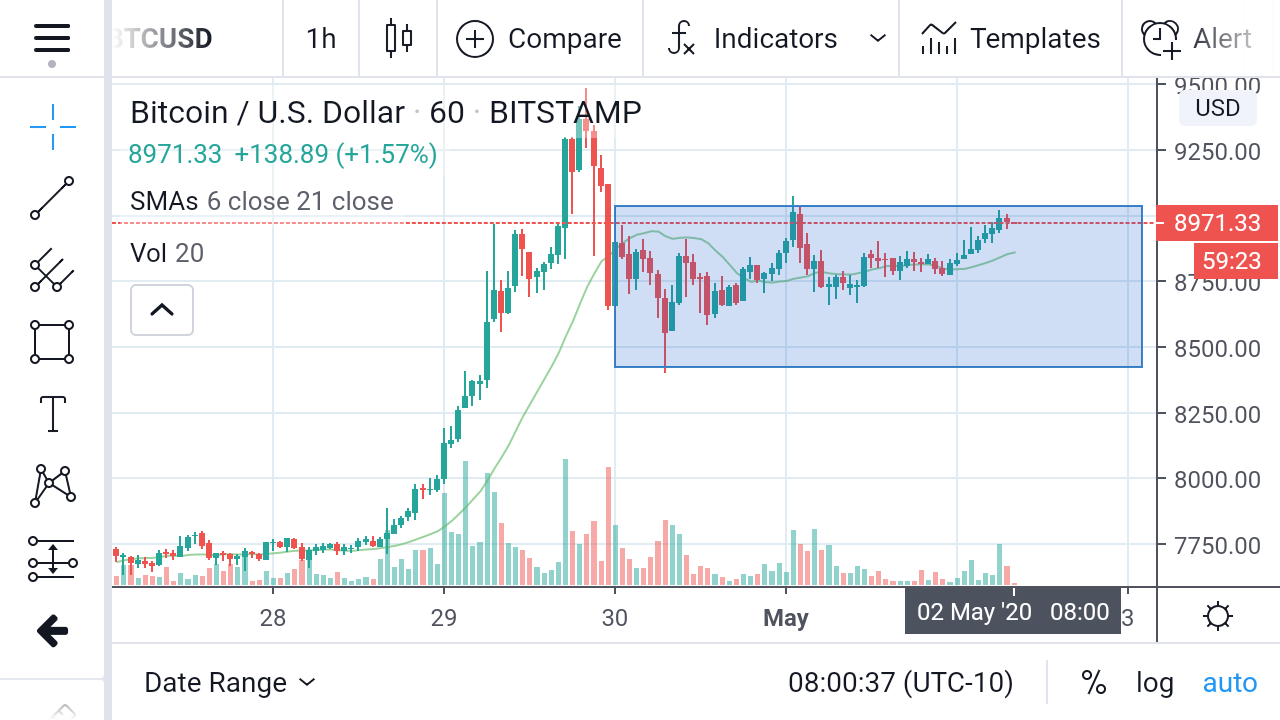
The picture above shows BTC trading at $8971 and it attests to the fact that a market always finds balance at any point in time after an impulse move. The blue box above is the zone of balance and this means we can expect the market to range at this point.
Given that the price fell from a high of about $9500 into a balance zone could only mean two things namely;
- Consolidation or
- Change of Trend
Of course, both are as a result of exhaustion or let’s simply put that sellers took over buyers and drove the price down to point A ($8400) before buyers came back into play and moved it back up. As you can see the reign of the bulls was short-lived again (See Point B).
Picking a side..
Now to the point of today’s post. Which side would I pick trading today? A short term sell and why? First, let’s zoom into the chart to check for any chart or candlestick pattern.
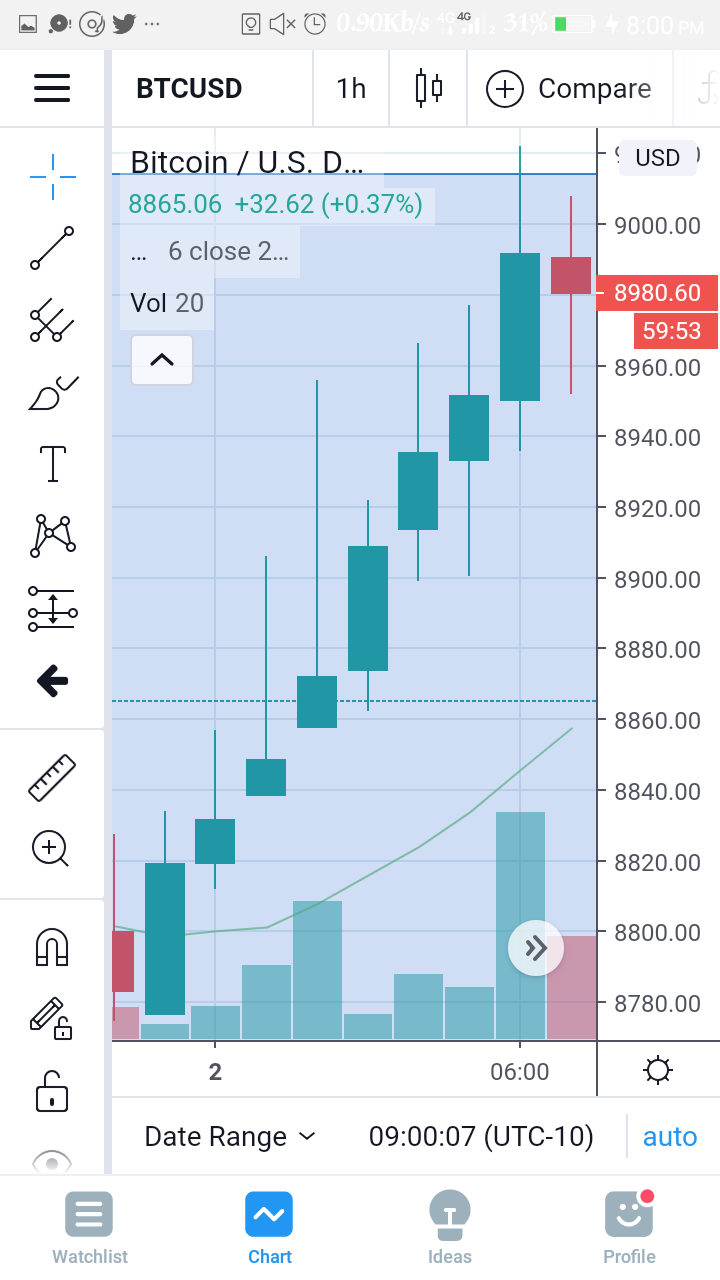
- I can clearly see a bearish inside bar which is a reason to sell.
- The bearish bar showed up at the upper band of a range which signifies a fall.
- A reduction in the volume; a confirmation of a short term sell
Trading this, I would put my TP 1 at $8855, given that the dynamic support would reject the price. My projected TP 2 and 3 would be $8776 and $8700 respectively.
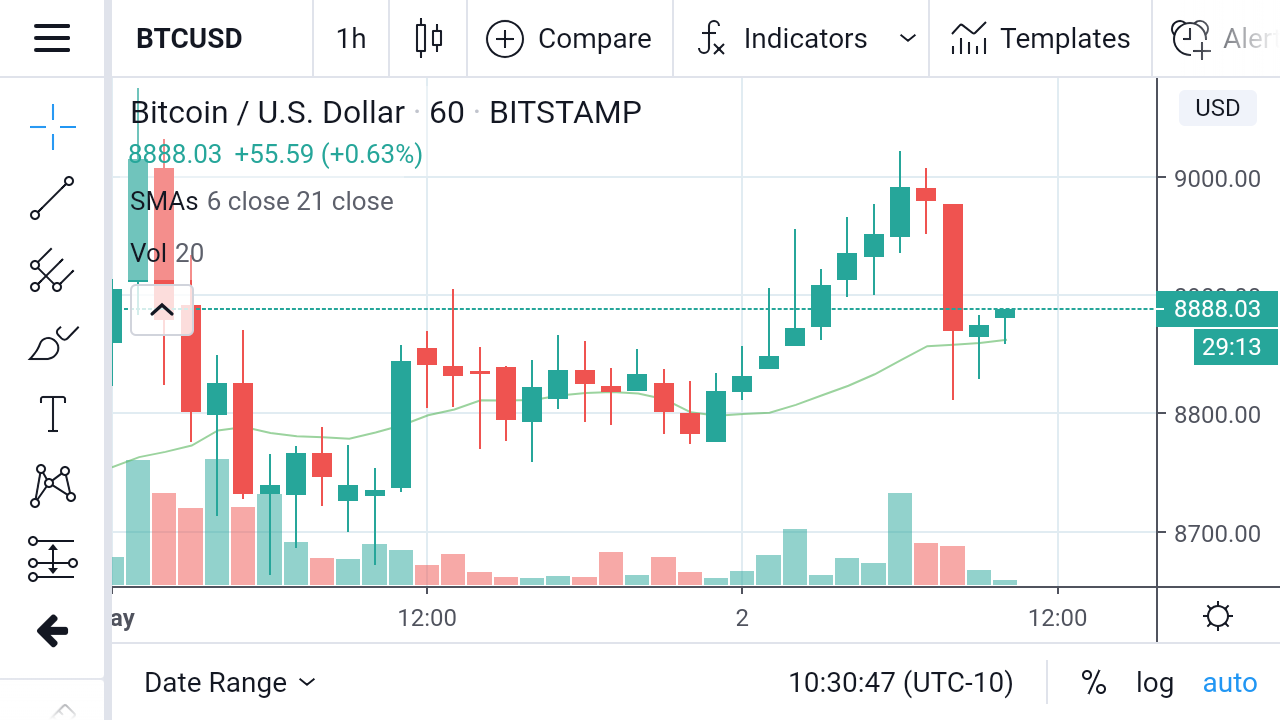
Coming back to my screen at the end, I see the price has hit my TP and had a taken a turn up so I decided to watch till the close of the candle to see if I would still drop this post or not but as you can see, I posted. The bullish candlestick that formed at the end of 9:00PM(UK time) is a bearish continuation.
Disclaimer: This is not a trading advise and I won’t be held accountable for any losses incurred during trading.
Safe Trading!
Your level lowered and you are now a Red Fish!
Do not miss the last post from @hivebuzz:
Vote for us as a witness to get one more badge and upvotes from us with more power!
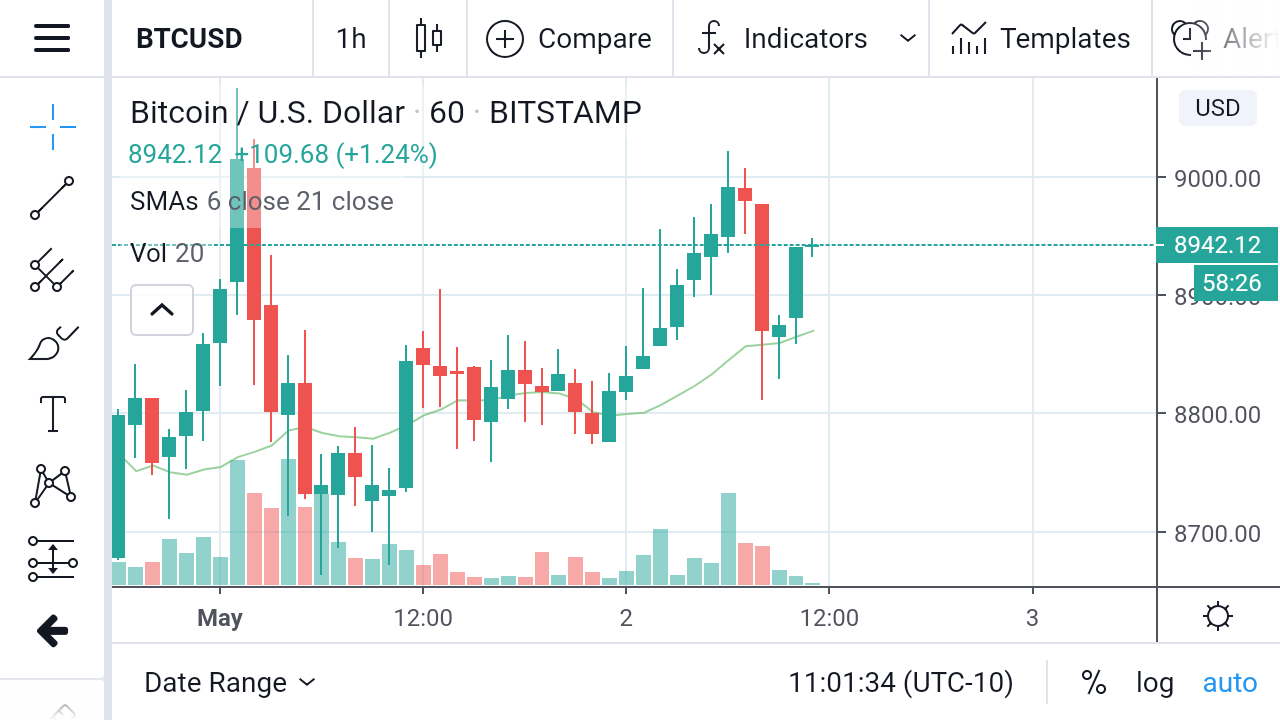
Now, we have a reversal pattern, a morning star!
Welcome to Hive and the TA community :D!
Keen to see how this plays out in the next day or 2.
Looking forward to seeing more charts from you!
Thank you, ozchartart
This is an excellent post prediction. Now we are short.