HIVE/USDT Analysis 23.05.2020
Hi guys, welcome back!
Today is quite the first time I'll be doing an analysis on Hive (the native currency of this platform) and I think it's great because personally, I'm happy about this.
When Hive listed initially, an analysis couldn't be done because of a lack of data which usually is a barrier to good technical analysis or even any technical analysis at all. But as it stands, there is more than enough data to ascertain where the next move would be in the short term time frame. Come with me!
TimeFrame: H4
Tools:
Blue Box: Support and Resistance Zone
Green Line: Dynamic Support
Blue Lines: Trendline
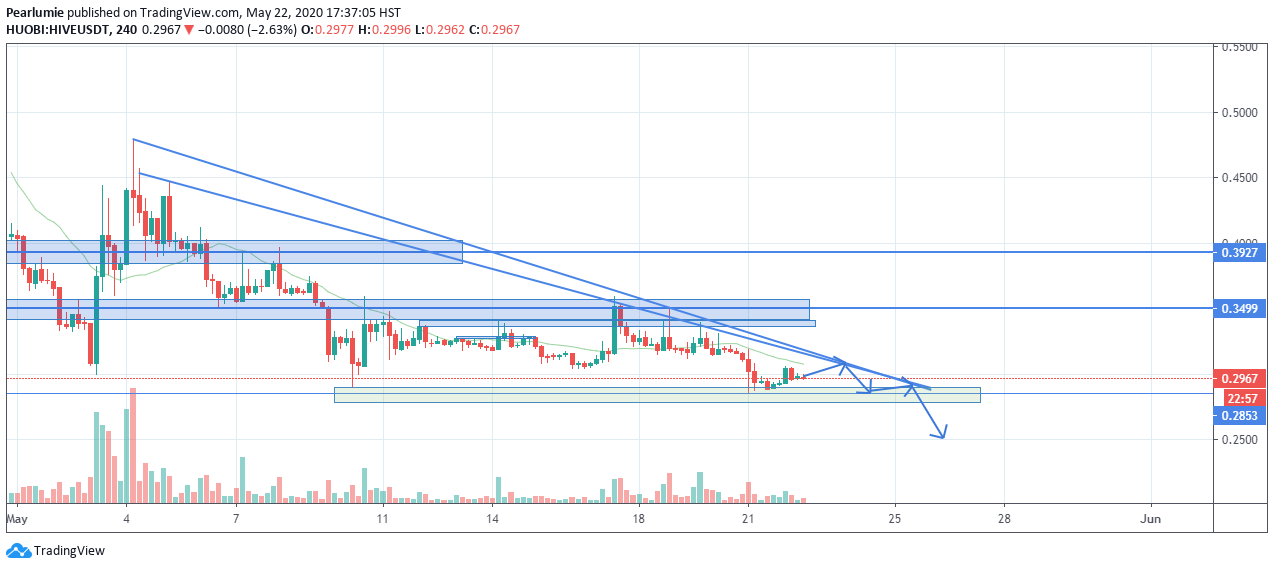
Taking a look at the chart with me, no one needs a soothsayer to know that HIVE/USDT has entered a downtrend which I do not pray this persists for long, however, it's not what I want that matters but what the market is saying to me.
A quick look at the previous price levels shows that price has bottomed around the current price ($0.29) a few number of times before rallying up but the rally points having reducing over a period of time as price refused to break a new high during those rallies (a typical characteristic of a downtrend).
On my chart, I tried to replicate a Fibonacci Fan which I couldn't find in the indicator column on trading view. I'll like to state at least two more things evident on this chart [1] The replicated Fibonacci Fan which acts as a trendline in combination with the horizontal support form a descending triangle which more often than not results in a bearish movement. [2] HIVE/USDT has more resistance zones than support.
Let's go to...
Picking a side..
Of course, if you read from the beginning you already know the direction of this trade set up. I'll like to add that according to the arrows, entry point is not set at the momtn and if you're taking this trade, you have to wait for a good time to enter.
Well, I like to state the reasons for my bias. So...
Downtrend; The trend is my friend.
Price Action; A dark cloud cover has formed.
Trend Qualification; Confirmed!
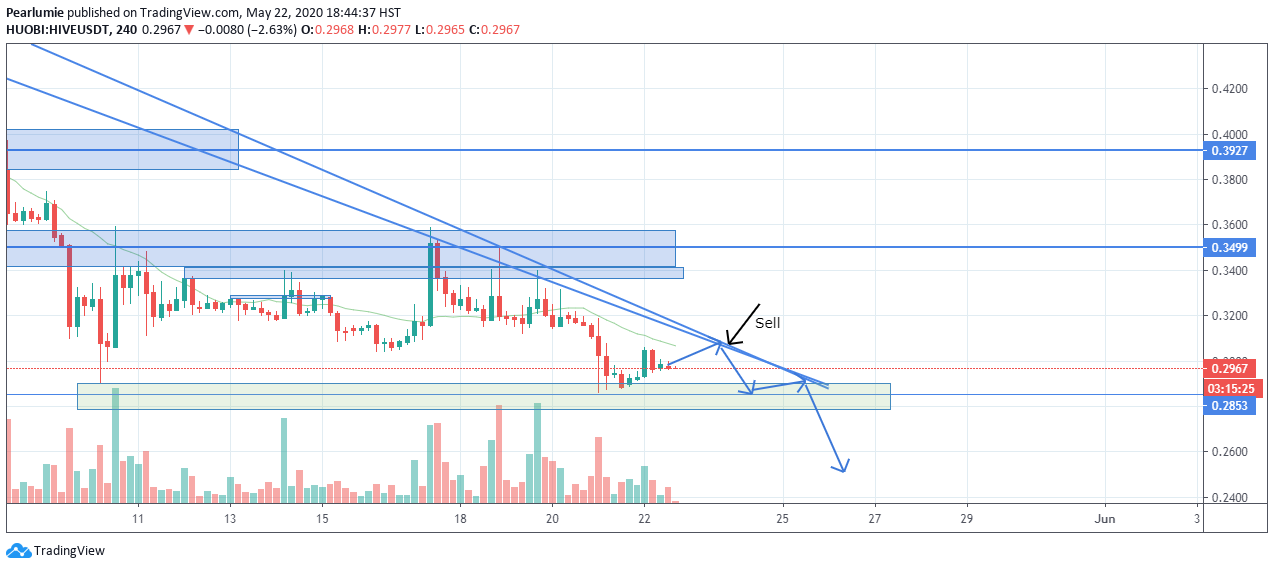
Entry should be around the $0.3086 (the indicated price on the chart) or if a falling three was formed at the end of the current candle on the H4 time frame. Profits should be taken around $0.25 or $0.23
Disclaimer: This is not a trading advice and I won’t be held accountable for any losses incurred during trading.
Safe Trading!
then according to what you say it would be good to sell at about 0.31 because from that point on it can fall.??Although I still think we'll go back to 0.35 and if we don't break that resistance, I'm 99% sure we'll go in the range of 0.20 and 0.30, since we've tried several times in the last weeks to break 0.35 and we haven't been successful
You're right!