BTCUSD position Day 59 of 100DAYSOFTA
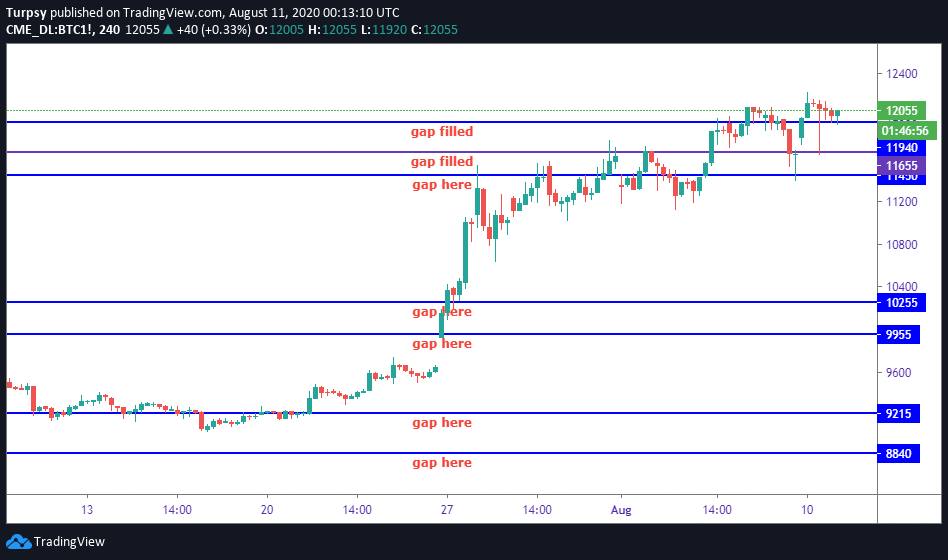
The CME market is now open and some of the gaps are unfilled.
12090 USD.- Filled
11655- Filled
11450, Filled
11958
10255,
9955,
9215
8840 USD.
The sharp drop in the price of btc filled some of the CME gaps, which was left over the weekend. We can see that these gaps served as a kind of level which prices respect.
https://www.tradingview.com/x/XdZ7CnV7/
This is my entry for the 100DAYSOFTA challenge, Monday 11th August 2020.
__
I am joining a challenge by a group of traders. The challenge is #100DAYSOFTA. Some of the people in this group have posted on $Youtube, $Twitter but I will be posting mine on Hive.
The convener of this challenge is https://twitter.com/CryptoluXP
However, the frequency might not be daily but it will be sequential.
Having said that, here is what I have:
__
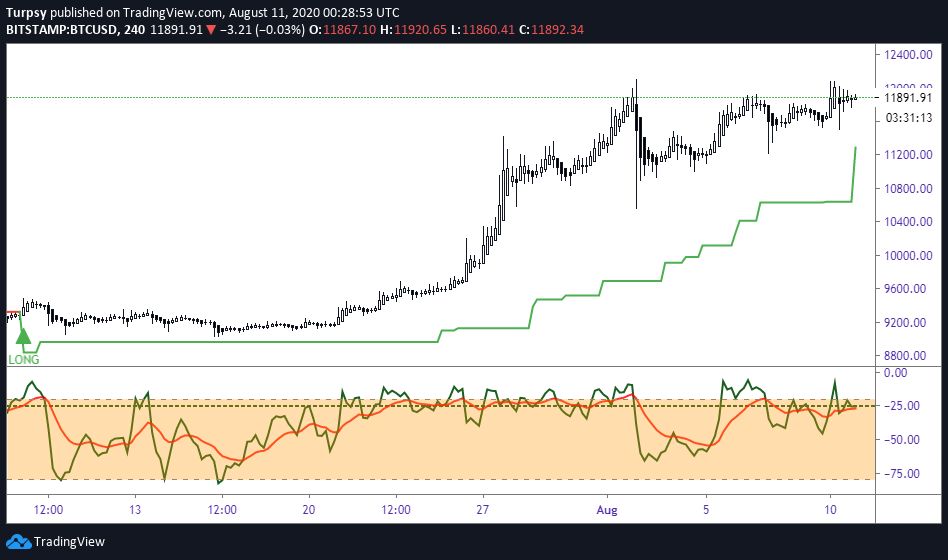
4 hr
The groove is still on and the trend is still our friend till the end. So, this means we should feel comfortable with a stoploss to long the drop we may see in the market. These are opportunities to pick up BTC at a discount. That means ST is still guiding our bias. Willy is also at the overbought region and can stay in this range for a while or just reset.
https://www.tradingview.com/x/UUU7JXlP/
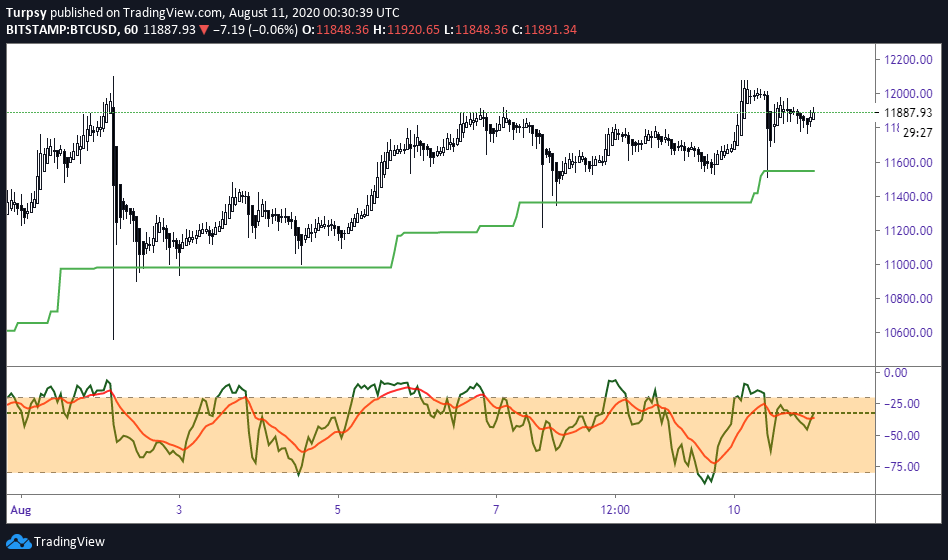
1h
ST is long, Willy is forming a W pattern but this doesn't guarantee that we wont drop again. The pattern seen on this TF is that BTC has failed to close below the support, which is bullish trend. A closebelow the support at around 11500 USD, means we would see a change in trend accompanied by more downside. Willy is resetting and it is highly expected that Willy should be at oversold region if we want some more bullish action.
https://www.tradingview.com/x/fJHSLYxY/
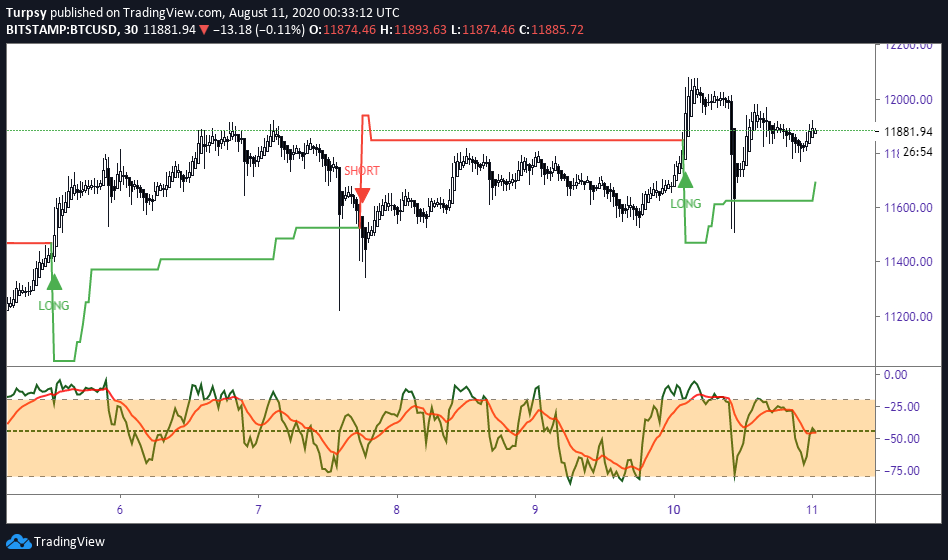
30 mins
The chart of this TF has been dynamic. This means we are faced with an option to make decision based on higher TF. Although, the change in trend and start of a trend is easily seen on this TF, but the noise also is much. ST is now long onthis chart and Willy undecided though, since we need more price action to know which the price will go.
https://www.tradingview.com/x/6OQT3hXT/
Extras
15mins and 5 mins charts respectively.
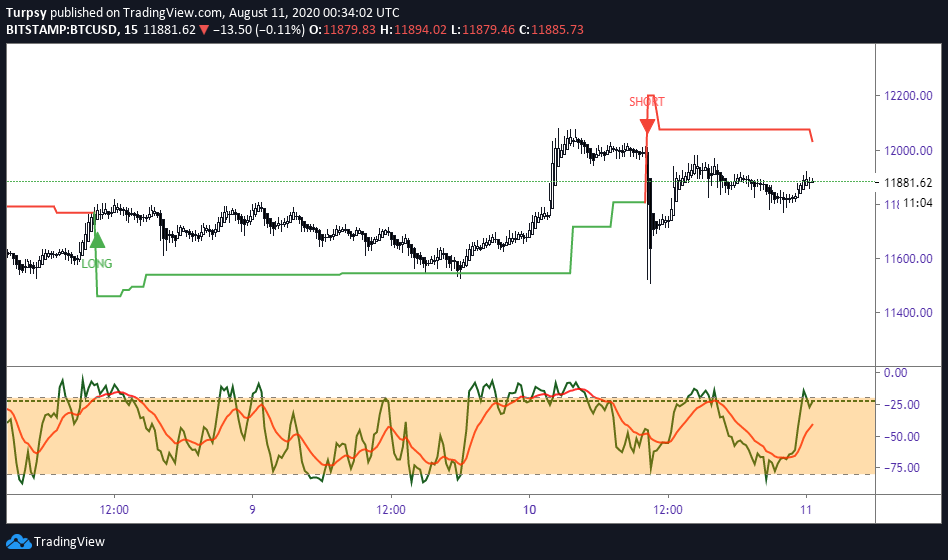
https://www.tradingview.com/x/eBfXp1Sx/
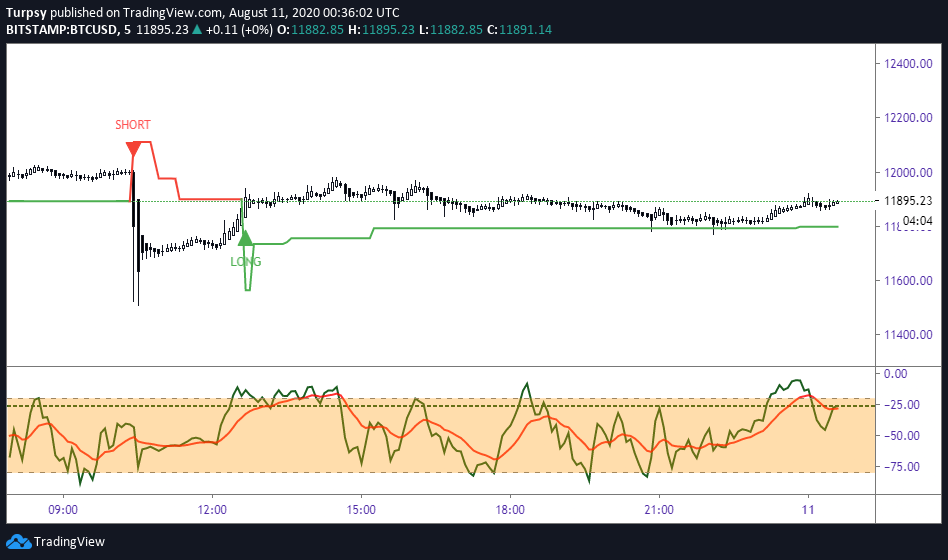
https://www.tradingview.com/x/U6lgsml9/
Summary:
4hrs ST is long
1hr ST is long
30 mins ST is long
My Position
It is good to be watchful of the market now.
The best position is now to dollar cost average. One thing is that we should now be targeting buying at the support of the TF, especially 1 hr and 4 hr, probably 30 mins TF too. This will improve our portfolio management.