BTCUSD position Day 70 of 100DAYSOFTA
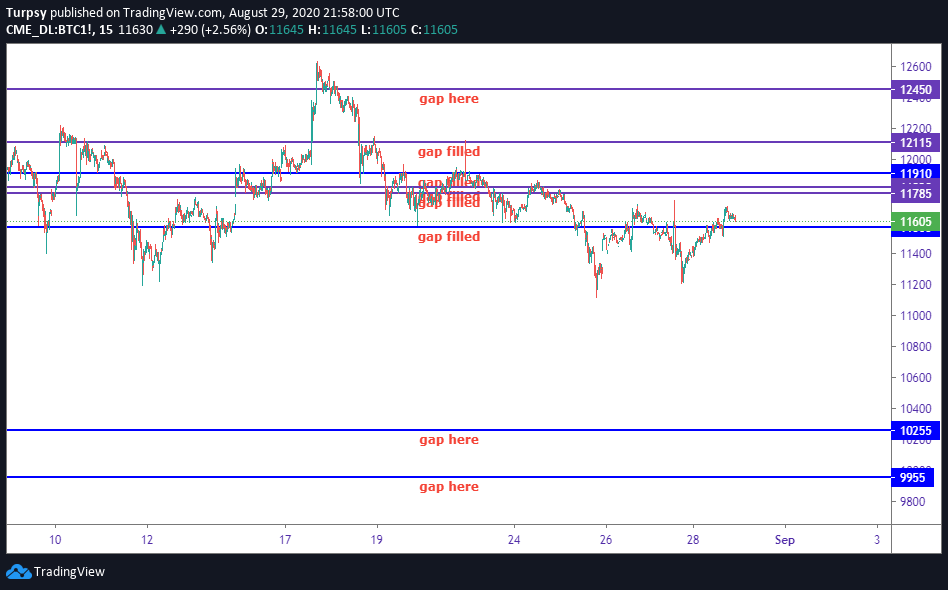
The gaps left to be filled are few and since we had that drop we are sure to get the price upwards. Since the obvious gaps are filled then we can see that lower prices might either get filled now or much later. The CME market is closed and by Sunday evening we will have a new price action.
11900 USD.- Filled
11820- Filled
11785 Filled
11580, Filled
10255, -Not yet
9955, -Not yet
9215 -Not yet
8840 USD. - Not yet
https://www.tradingview.com/x/MP6R5tMi/
This is my entry for the 100DAYSOFTA challenge, Tuesday 25th August 2020.
__
I am joining a challenge by a group of traders. The challenge is #100DAYSOFTA. Some of the people in this group have posted on $Youtube, $Twitter but I will be posting mine on Hive.
The convener of this challenge is https://twitter.com/CryptoluXP
However, the frequency might not be daily but it will be sequential.
Having said that, here is what I have:
__
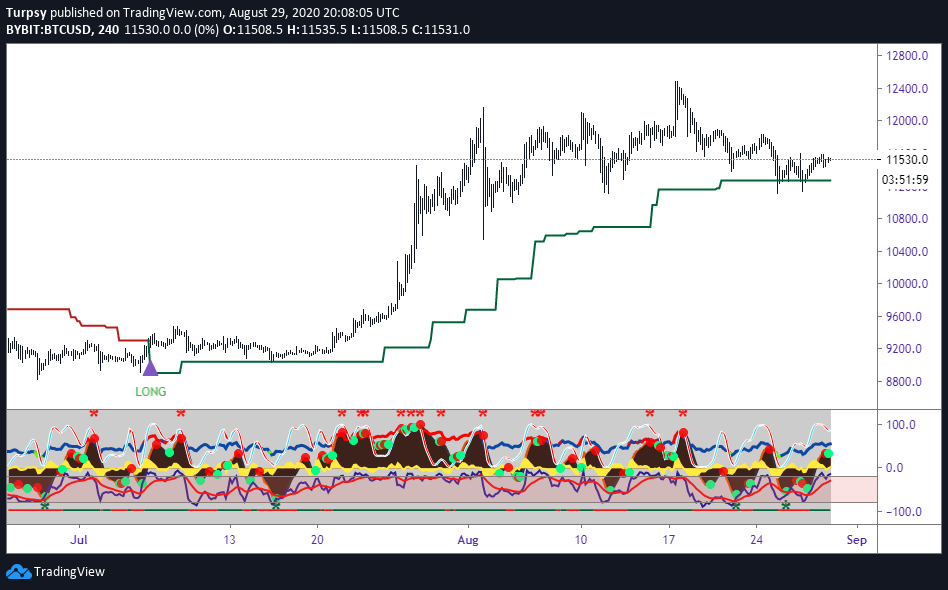
4 hr
Without any much thing said, this is a perfect support that 4hr has provided to the price. This is one of the reasons that I love this timeframe. We can see that we have a region of which we can easily set our buy order and expect some sort of support. The recent drop held on the 11180USD and has since then bounced back upwards. This means we can expect a change of trend and further downward price if price falls below this level. However, we have Willy at the overbought level, with a possibility to either form a double top or the willy gets pushed upwards to the overbought region again. On the wavetrend we have the green dot which signifies some bullish action.
https://www.tradingview.com/x/JshFwtYn/
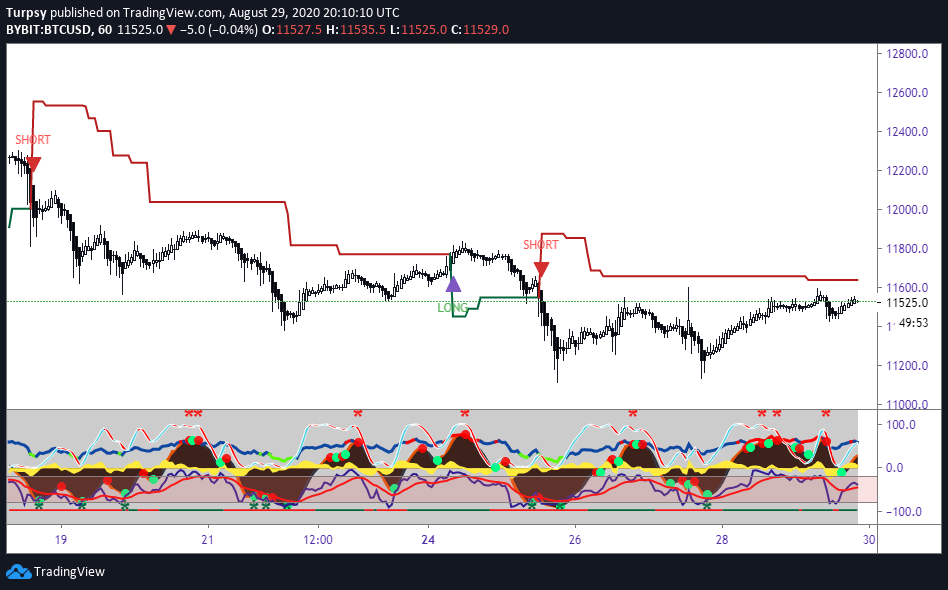
1h
Right now, we may have the 1hr trend acting as a resistance. We have seen how well this has pushed the price downwards. This means if we had followed this trend, we would have made some really nice profit. The ST indicator on this TF is quite accurate and helpful. Right now, we have resistance at around 11700USD, this means price can get to that region and probably fall downwards. Also, price might get to this level and break it upwards. It depends on the momentum. Willy is showing a kind of reversal, wave trend indicator shows we still have more room upwards.
https://www.tradingview.com/x/DRZuGU9U/
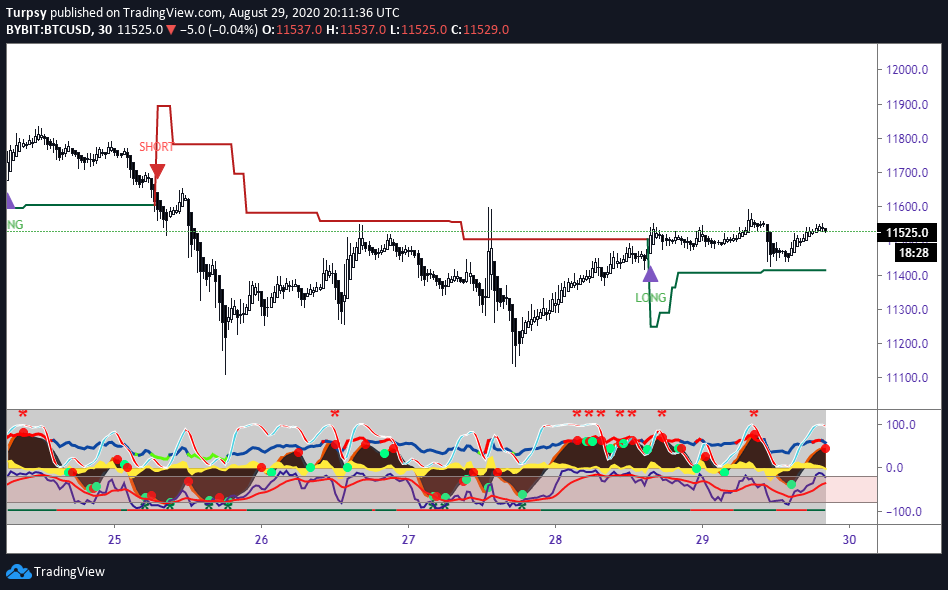
30 mins
Right now, this TF has been a good support for the past few hours. We can see the price bouncing off the support. This theoretically gives us a good price to look out for. Should it break that level, then we are going to have a change of trend. For the moment, we have Willy also at oversold level and the wave trend indicator showing a red, which means that there can be dump in the price. This is a good case of watching the support.
https://www.tradingview.com/x/ENgXpXi5/
Extras
15mins and 5 mins charts respectively.
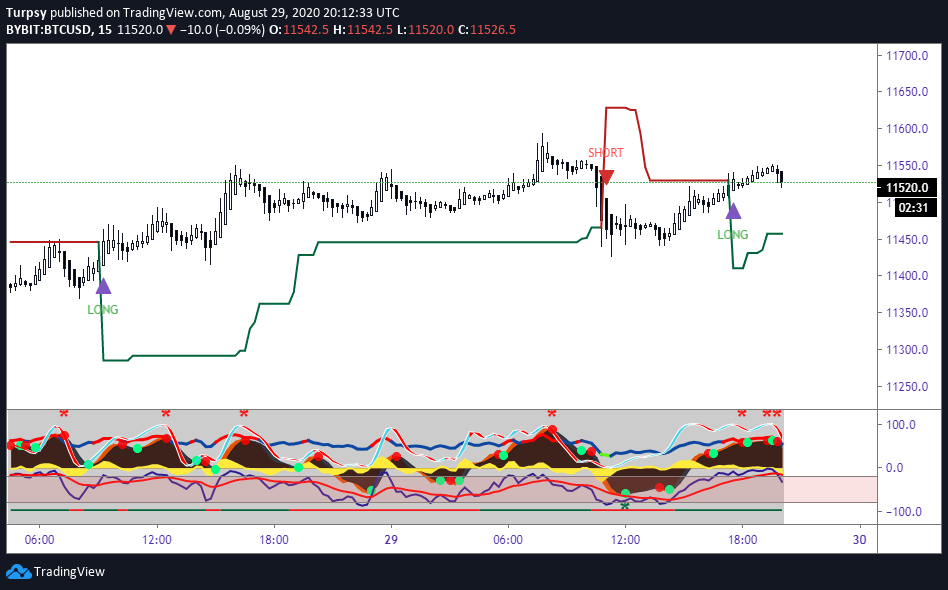
https://www.tradingview.com/x/fTDmgrrx/
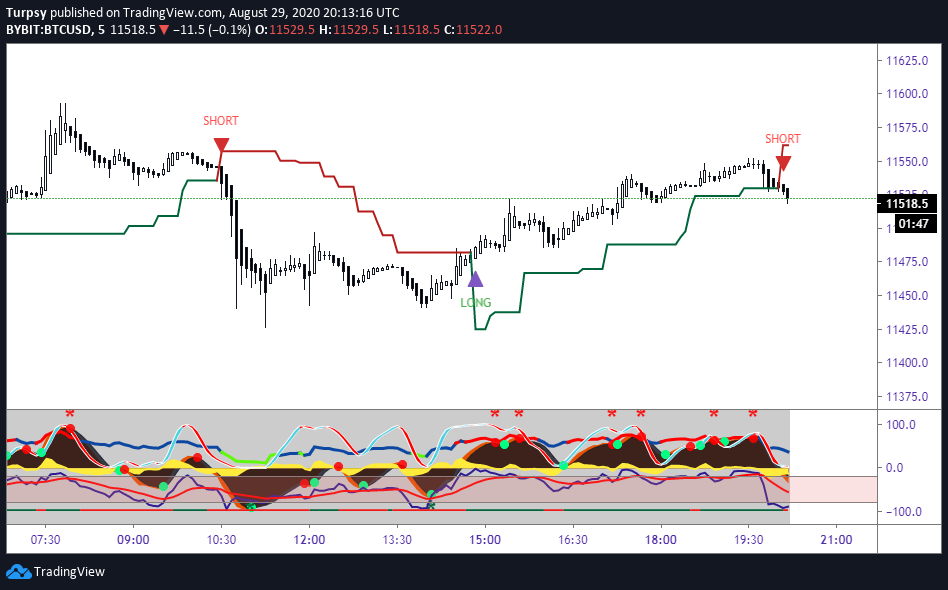
https://www.tradingview.com/x/qsa9ZrOm/
Summary:
4hrs ST is long
1hr ST is short
30 mins ST is long
My Position
This is what I wrote the last time. I look forward to taking a position soon
I will be looking for a long if the 4hr is not closing below the 11111 USD.