Steem-Engine Tokens Report 11 – Token Price History Is Finally Here!

Summary
- Steem-Engine historical prices are available now “in test”.
- A little difficult to use, but I show you how to draw your own chart.
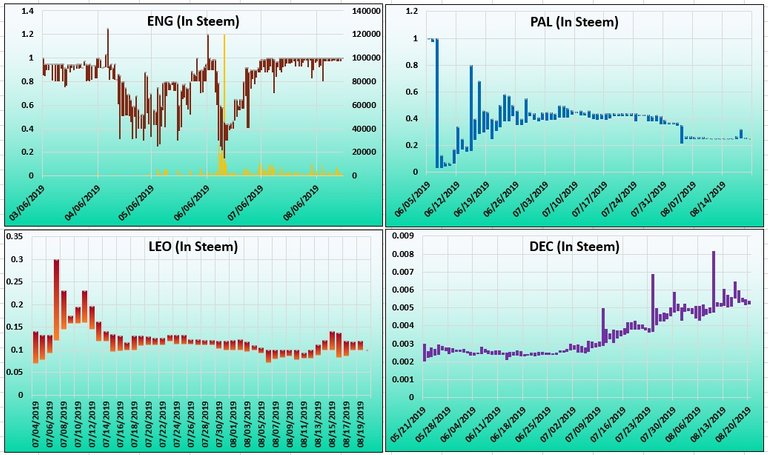
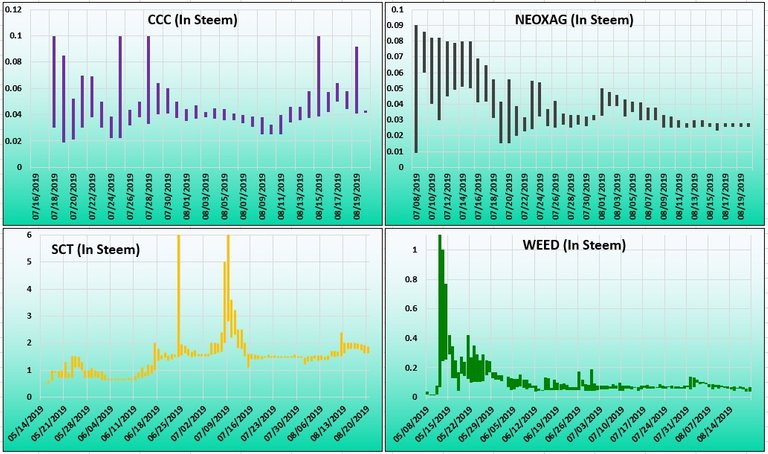
- Prices in Steem are much more smooth and equilibrated than in USD terms.
Finally the missing data
I suppose not many people noticed the post of developer @harpagon some days ago, about “market history tool for Steem Smart Contracts now available in test”. Even fewer people could use the output data which those site (api.steem-engine.com) provides. But this tool is something very important, as it offers us the missed Steem-Engine tokens price history.

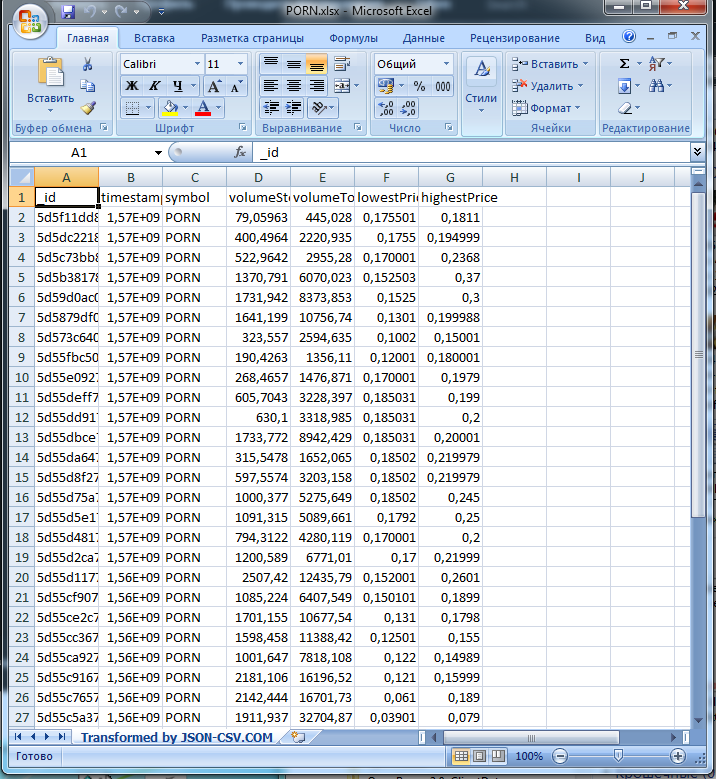
First I couldn’t use the output data as @harpagon didn’t document it and I’m a “lamer”, not very well educated in programming or web databases. Then I discovered the output was .json format, which can be imported into Excel. (More accurate explanations by @theexcelclub.)
Don’t give me fish, teach me fishing
I’m on vacations and have to leave soon, so, I can’t analyze so much data. I drew “only” eight charts... Better I show you how to make your own charts or tables. How to get and use this data – in some simple steps for newbies, lamers like myself:
- Use the adequate URL in browser address line containing the token name, for example, “https://api.steem-engine.com/history/marketHistory?symbol=WEED”
- Select it all (Ctrl+A), paste it in Notepad or other word processor and save it as JSON file. (For example, “WEED.json”.)
- Upload it do JSON to CSV Converter, then download it in Excel format (or CSV). Open in Excel or OpenOffice spreadsheet, etc.
- You may want to convert the “Unix timestamp” to Excel date format. It is a simple formula, described here.
- I wanted to chart it, but I realized the simplest Excel price type chart needs three input columns (low, high, close). Harpagon’s data has only low and high. I invented a trick and doubled the daily highs as they were closing prices. The output looks fine, you see it in this same post.
- If you want to format the lines, you must format the “difference lines”, not the series itself.
Steem prices are more soothing
That’s all, I think. The big difference between the data I’m collecting from the Steem-Engine home page, and this data is, I was working with USD prices and these are Steem prices. Both have advantages and disadvantages. If I could I would choose both information. Investors can get never too many insights. (Links to my previous posts below.)

The Steem prices are much more equilibrated, are falling less than USD prices. Steem and Steem-Engine tokens are moving more or less together in dollar terms, as I described various times before. (See links.) These charts I’d like to improve with volume data, I could draw average prices and calculate USD prices, too. Maybe after my vacations and the imminent HF21 flag wars. But if I disappear you know now how to draw your own chart now.
Strange jumps
Some tokens were incredibly volatile in the first day, so were LEO or DEC, therefore I omitted the first day’s data. (Between 0.001 and 1.0 Steem, 1000 percent, for example, that is not a market, is a joke.) Other tokens had strange price jumps that can be errors, like SCT for 77 USD (!) or WEED for 4.2. To preserve the readability of the chart, I put these strange data out of range on the axis scale.
Don’t invest all your money in risky assets. Have a nice summer.
Series Steem-Engine tokens reports
10. A Quick Time Travel
9. More Tribes, More Tokens, Lower Prices
8. Light At The End Of The Tunnel?
7. Are Tokens Underperforming? Introducing The SETX Index
6. Losses, Losses, And More Losses
5. How To Be Rich, Quickly!
4. A Costly Hobby For Rich People?
3. Which Was The Most Traded Coin?
2. Which Token Fell 80 Percent In A Single Day?
1. Do You Still Believe In Your Tokens?
If you want to message me in private you can find me in various popular Discord channels (Palnet, Steemleo, Steempeak, Neoxian, dPoll, etc.)
(Cover photo: Own work)
This is great news! It will be useful to handle all those tokens
I always wanted to see these graphs! Thanks for sharing!
Finally!
Posted using Partiko Android
ahhhhh ! that’s AWESOME 😎 !
let’s look how much I let with my non stop bull buying ! thanks for sharing @deathcross :))
Awesome info.
Finally the tools we have been waiting for
Posted using Partiko Android
Thanks, @deathcross! I was looking for it!
This post has been included in the latest edition of The Steem News - a compilation of the key news stories on the Steem blockchain.
I liked it - now I will try to repeat !

I translated into a table - but how do I make a schedule?