Ag Analysis Report 10/13/19 - Soybean Catching Bids Due To Trade War Phase 1 Deal

On Friday the U.S. and China agreed on a phase one deal. The US will not move ahead next week with plans to raise tariffs on $250 billion worth of Chinese goods to 30% and China will include increase agricultural purchases and address financial services and technology theft.
Phase 1 would provide much needed relief to the American farmers because China would buy $40 billion to $50 billion worth of American agricultural products annually.
Treasury Secretary Steven Mnuchin said the agricultural purchases could scale up to $40 billion-$50 billion annually as part of a partial trade deal, potentially more than doubling the $24 billion in agricultural and related products China purchased from the United States in 2017.
Farmers, who relied on China as the top buyer for U.S. soybeans and sorghum and a key market for pork and dairy, have seen their incomes plummet during the 15-month conflict of tit-for-tat tariffs between the world's two largest economies
As part of the deal, China would significantly step up purchases of U.S. agricultural commodities, agree to certain intellectual-property measures and concessions related to financial services and currency, Trump said Friday at the White House. In exchange, the U.S. will delay a tariff increase due next week as the deal is finalized, though new levies scheduled for December haven’t yet been called off.
This was an easy bone for China to throw in as part of the Phase 1 deal. China is the world's largest consumer of soybeans and bought more than half of American exports last year. In addition, China doesn’t have the means to increase their domestic production of Soybeans.
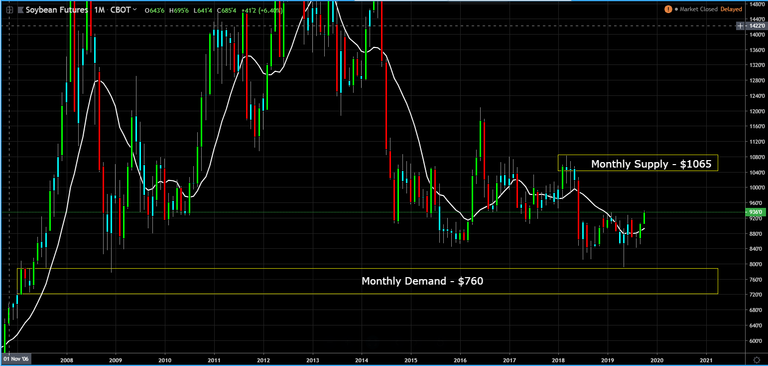
More than a year ago, China canceled all shipment of beans from the U.S. causing the prices in the soybean futures market to drop to the lowest price in a decade. So if the China is going to scale up their agricultural purchases to $40 billion-$50 billion annually, how high can Soybean prices go, lets go to the charts.
Monthly Chart (Curve Time Frame) - monthly supply is at $1065 and monthly demand is at $760.
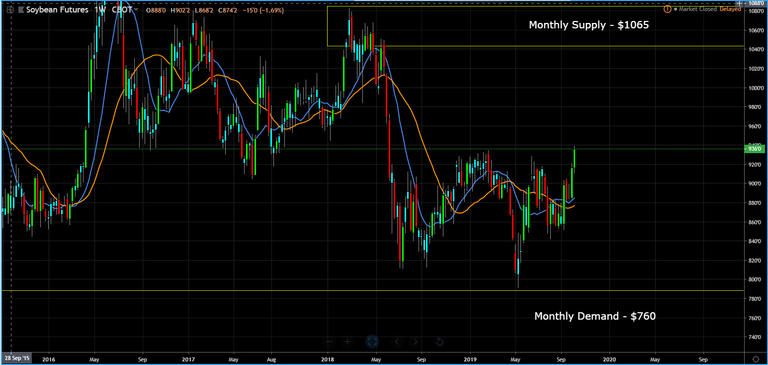
Weekly Chart (Trend Time Frame) – the trend is sideways with upside bias.
Daily Chart (Entry Time Frame) – the chart suggest go long on a pull back with a final target at $1020.

This post is my personal opinion. I’m not a financial advisor, this isn't financial advise. Do your own research before making investment decisions.

Thank you for posting from the https://steemleo.com interface 🦁
Congratulations @rollandthomas! You have completed the following achievement on the Steem blockchain and have been rewarded with new badge(s) :
You can view your badges on your Steem Board and compare to others on the Steem Ranking
If you no longer want to receive notifications, reply to this comment with the word
STOPTo support your work, I also upvoted your post!
Vote for @Steemitboard as a witness to get one more award and increased upvotes!