BTCUSD position Day 49 of 100DAYSOFTA
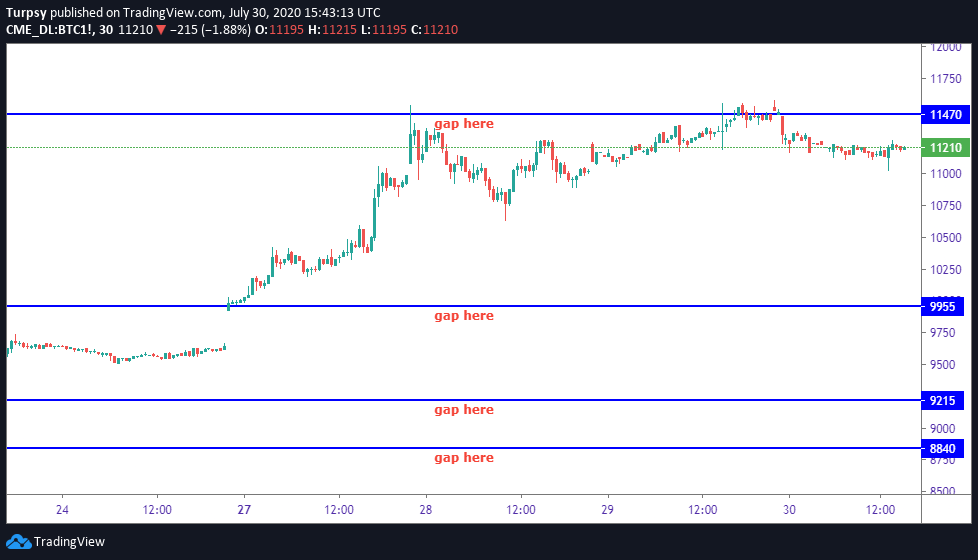
The presence of the gaps at 11470, 9955, 9215 and 8840 USD are obvious, and these are prices we should watch to be filled or ignored. It is definitely something worth paying attention to. At least, we can have the knowledge bank of how these gaps works, if they truly work.
https://www.tradingview.com/x/ZUxHbpTU/
This is my entry for the 100DAYSOFTA challenge, Thursday 30th July 2020.
__
I am joining a challenge by a group of traders. The challenge is #100DAYSOFTA. Some of the people in this group have posted on $Youtube, $Twitter but I will be posting mine on Hive.
The convener of this challenge is https://twitter.com/CryptoluXP
However, the frequency might not be daily but it will be sequential.
Having said that, here is what I have:
__
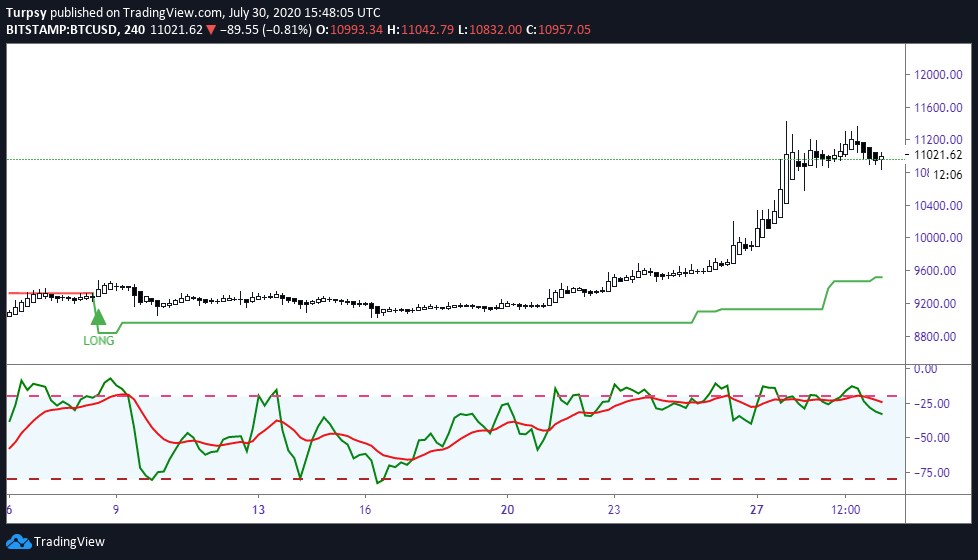
4 hr
This chart has been parabolic and we can still see that the indicators are all oversold. This means we can look for trades that are low risk. Looking at the ST indicator, we have the trend as long with the invalidation price at 9523 USD. This shows that if we get a drop to that price level we should expect a bounce and price movement. However, Willy has been overbought and it is already correcting, however, we know that Willy can overstay in this region for long. This is very possible. We should keep an eye on it.
https://www.tradingview.com/x/OtSYDBT3/
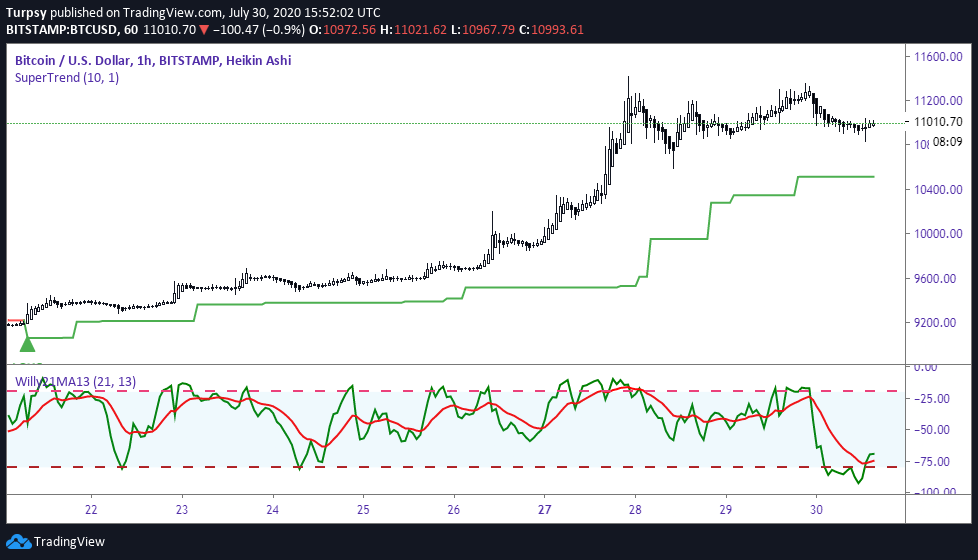
1h
Also this TF we have ST as long. This is very good and shows we might have some action that is upside. There is a good chance of the support helping the price. The invalidation of this trend is at 10513, at which point we have to flip short. On this TF we also have Willy showing a bullish cross with an oversold condition. The says that an uptrend in price is possible
https://www.tradingview.com/x/Rc8Cipl6/
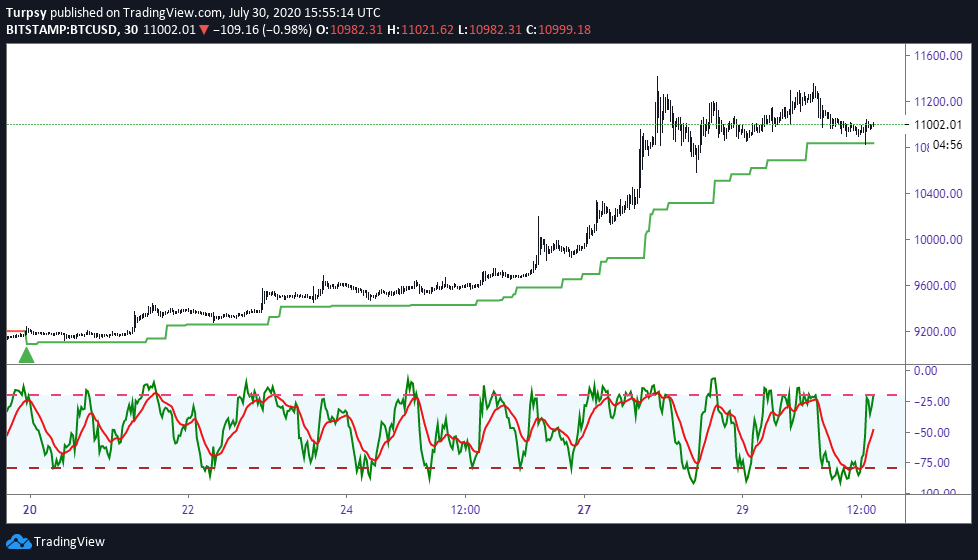
30 mins
This TF is a major Tf to spot a quick downtrend and already, we can see a support at the ST support level which is at 10836 USD. Another touch of this price and the price holding up, means we should see a good bounce. This is expected, since the support might hold. We also have Willy at oversold area, definitely means we either retrace to touch the support again or we experience a downward price later.
https://www.tradingview.com/x/qQR4sUGj/
Extras
15mins and 5 mins charts respectively.
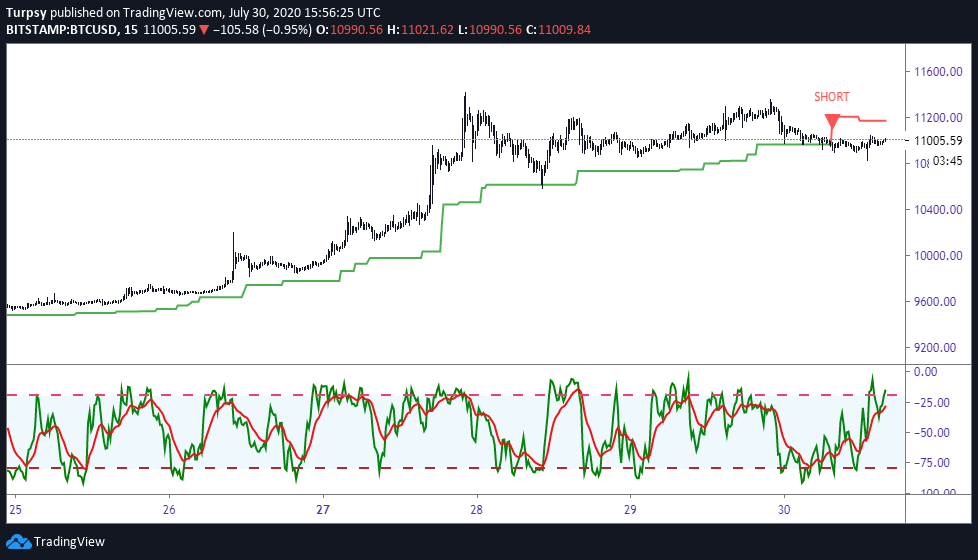
https://www.tradingview.com/x/WgL02Ua1/
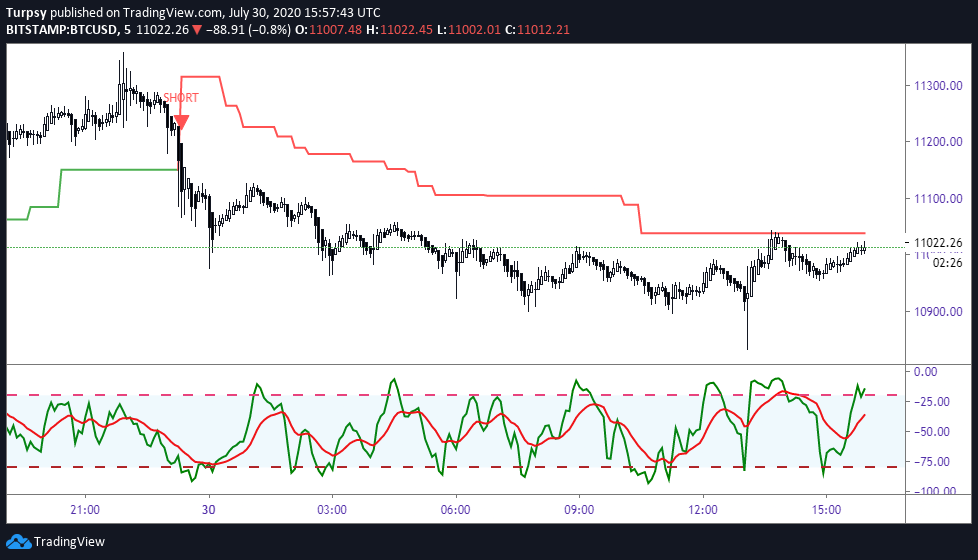
https://www.tradingview.com/x/eUSsxeqh/
Summary:
4hrs ST is long
1hr ST is long
30 mins ST is long
My Position
The decision is to be derived from the ST.