Digital images processing to determine physical characteristics of quinoa seeds - [en/es].
The physical characteristics of the grains and/or seeds are fundamentally important when the objective is to design and develop machineries and processes for productive development. The physical characteristics will influence the working parameters of the equipment or machinery to be designed, and in addition to the construction of structures or facilities that involve the operational steps of harvesting, transport system, separation, drying and aeration of the seeds until storage and processing. In addition to the aforementioned importance, it is also added that they are parameters of interest in the analysis of the quality of the seeds, the application of the existing regulations in the markets and fundamental for the design of packaging.
Among the physical characteristics of the seeds, some are size, volume, shape, density and porosity, and in determining physical characteristics some depend on or originate from orthogonal dimensions, that is, length, width and thickness.
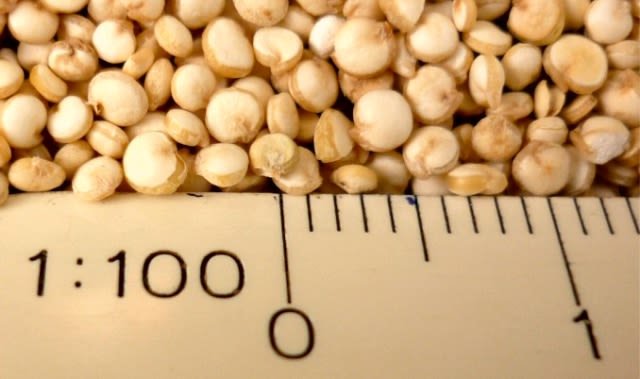
On the other hand, the nutritional value of quinoa (Chenopodium quinoa Willd.) seeds is widely known. If you want to read a complete review in Spanish you can click here. I mention quinoa because a very particular characteristic of the seed is its small size. In these seeds it is not feasible to make precise measurements of orthogonal dimensions using a Vernier caliper. As an example to give an idea of the size, in the following image I compare seeds with a scalimeter.
For the purpose of measuring quinoa seeds, a colleague from Peru approached me with the idea of making measurements on those seeds using photographs of them on graph paper and Corel’s PHOTO-PAINT version 11 software; making use of the pixels in the images. After online communications, we decided to initially determine the orthogonal dimensions through digital image processing using various programs, and then calculate the physical characteristics of the seeds.
Samples
We use two seed samples. One was from processed quinoa seeds from the Cabana District, San Roman Province, Puno Department (Peru) and the other consisted of processed quinoa seeds imported from Peru; that I acquired in a commercial establishment in Valencia, Carabobo State (Venezuela). I clarify that my colleague worked in Peru and I in Venezuela.
Software and equipments
The programs used were PHOTO-PAINT versions 11 (in Peru) and X5 (in Venezuela), Photoshop version CS6, Paint version 6.3, SmartGrain version 1.2 and GrainScan version 1.0 (in Venezuela). The digital cameras used were Panasonic (LUMIX), model DMC-FP3 (in Peru), used by default except for high-resolution image size calibration, and DMC-FS42 model (in Venezuela), calibrated using a procedure I used previously in another research. The GrainScan program requires a scanner and I used the HP Deskjet F2280 with HP Photosmart Essential software version 2.5, calibrated at 600 dpi (dots per inch) resolution. Computers with Intel® Celeron® 2.00 GHz (RAM 351 MB) processor in Peru, and Intel® CoreTM i3-3130M 2.60 GHz (4 GB RAM) processor in Venezuela.
Sample preparation and images capture
For the Peru sample, thirty quinoa seeds were placed on graph paper (observation distance to criteria), images were captured with the digital camera (DMC-FP3) and saved as files with the .jpg extension.
For the Venezuela sample, I set up a stage with a lampholder, using a General Electric daylight simulator (D65) reflector as the light source and, I placed the digital camera (DMC-FS42) on a support. The geometry of the illumination/observation directions was 45º/0º, the distance of the illumination angle 15 cm and the distance of the observation angle to criteria. In this stage I only placed 1 quinoa seed (labeled G0) on graph paper in order to measure the orthogonal dimensions in the captured images (files with the .jpg extension) in the PHOTO-PAINT, Photoshop and Paint programs, with the purpose of choosing one among the three programs to carry out other measurements on quinoa seeds. I clarify that so many details are not necessary creating a stage for this purpose; the reality of creating the stage was to photograph a portion of whole seeds and another portion of quinoa flour (partially ground seeds) to later determine the color in colorimetric coordinates (rectangular and polar) according to a procedure that I developed in another investigation, taking into consideration that I had the necessary equipments calibrated.
I used a subsample of five seeds labeled G1, G2, G3, G4 and G5 placed in the same position for the SmartGrain and GrainScan tests. For the capture of images with a scanner (in the case of GrainScan), I fixed the same five seeds with liquid silicone as an adhesive and in the same position on a sheet of plastic material in a matte black color (the sheet must be turned for to scan); sheet that I also used to photograph and get image for SmartGrain. I saved them as files with a .jpg extension.
Digital images processing
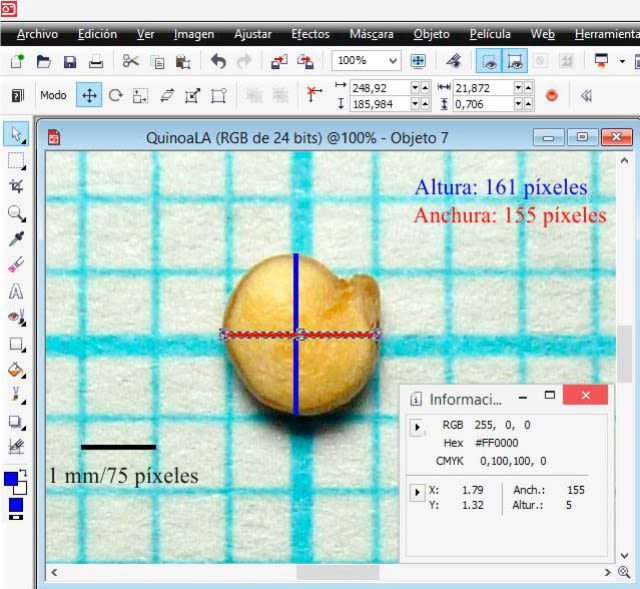
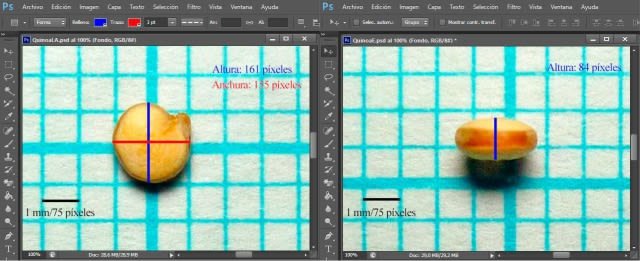
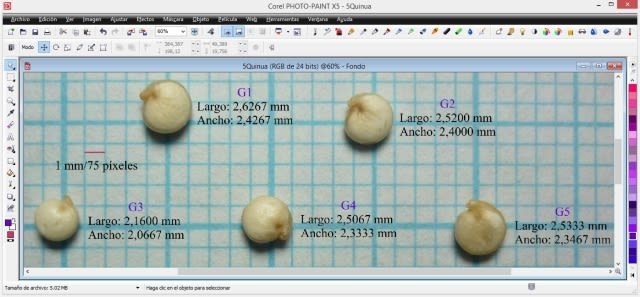
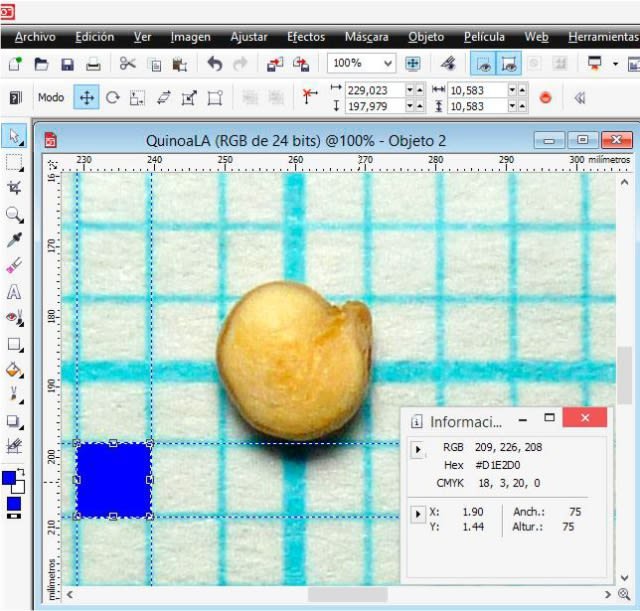
I opened the image with extension .jpg labeled G0 in PHOTO-PAINT and increased the zoom level until I could see the pixels. In the ‘View’ menu, I selected ‘Image info’, and this allows us to see a dockable window that provides information about the x (width) and y (height) coordinates. In the window I selected pixels as the unit of measurement and then with the ‘Rectangle’ tool, I drew one (in blue) by dragging the cursor in order to measure the 1 mm equivalent of the graph paper in pixels; in the following detail image it is observed that the height (altura) and width (anchura) was 75 pixels, that is, an equivalence of 1 mm = 75 pixels.

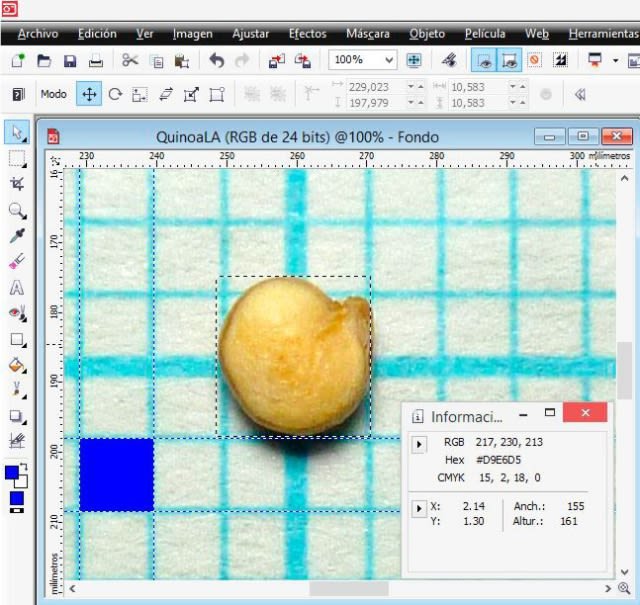
Using the ‘Rectangle mask’ tool, which defines editable areas, I measured the height and width of the seed in the image.

The same result is obtained by drawing a vertical and horizontal rectangle with the ‘Rectangle’ tool.
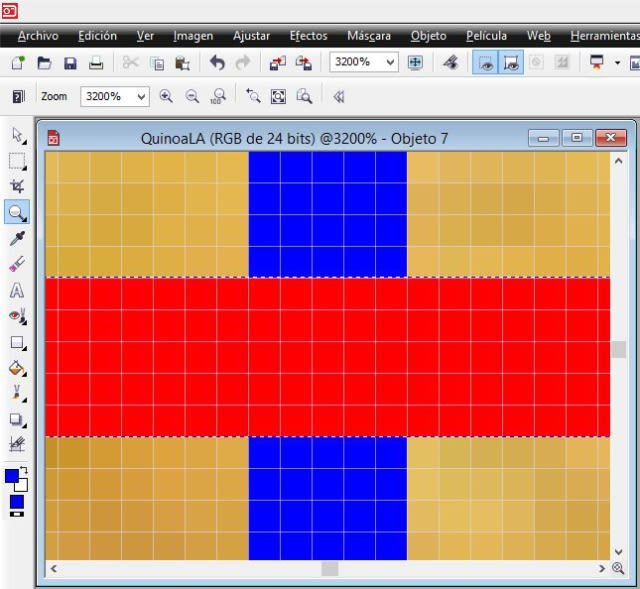
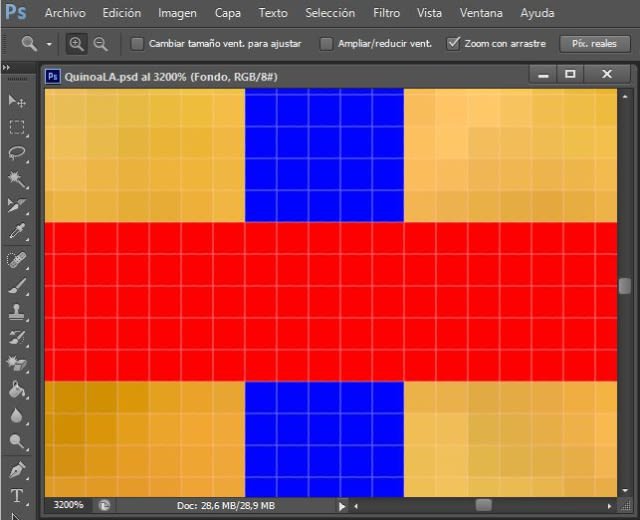
To appreciate the pixels of the previous image, I show the following one that corresponds to where the blue rectangle line crosses with the red one; each square is one pixel.
Now, for the seed thickness, the procedure is the same.
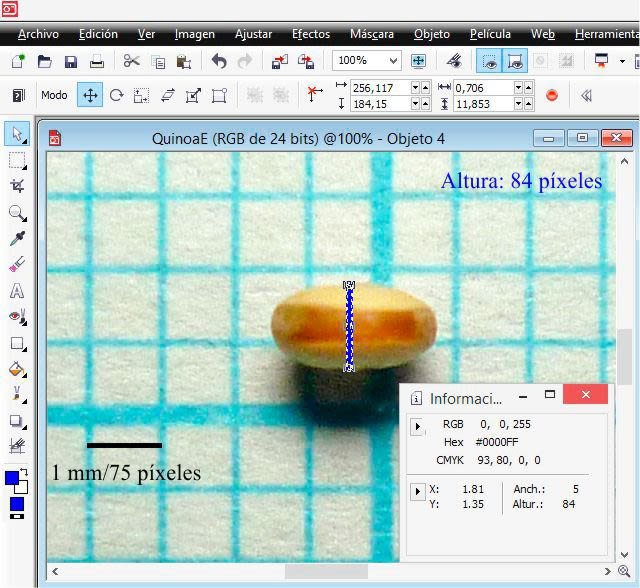
From the procedure using PHOTO-PAINT it is derived that in the image the height (length) was 161 pixels, the width 155 pixels and the height (thickness) 84 pixels. Then, based on the equivalence (1 mm = 75 pixels), the seed dimensions were: length 2.1467 mm; width 2.0667 mm; and thickness 1.1200 mm.
Similar procedure with the same seed file (G0) I performed with Photoshop and Paint programs for comparison and verification.
In Photoshop.
This is what pixels in Photoshop look like where the blue and red rectangle lines intersect; each square is one pixel.

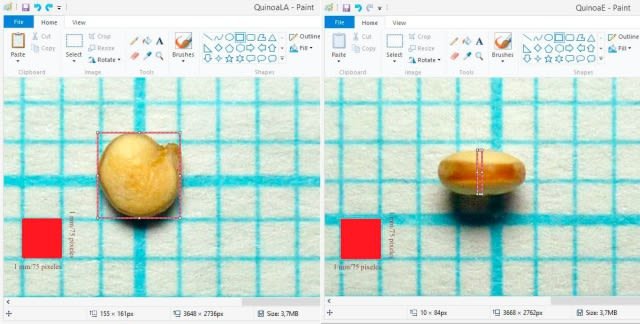
In Paint.
In conclusion, with the three programs the same expression of the result of a measurement is obtained; however, I opted to use PHOTO-PAINT for the following measurements that were intended to compare with SmartGrain and GrainScan (I was able to use Photoshop or Paint).
In the case of the subsample of five seeds (G1, G2, G3, G4 and G5) with the SmartGrain and GrainScan programs, I measured their length and width. Both programs require previous tests to remove areas that are not of interest, known as image segmentation, before the final morphological analysis. In SmartGrain I established a precision intensity in the detection of seeds by default (2 of 4) and in the threshold for the elimination of edges an intensity of detection “nogi” 4 (of 5); additionally, the false detection was corrected using the sustained shift key option. In GrainScan, to decrease a certain falsely identified detected area I set an automatic sensitivity threshold of 0.70. In all the measurements I made, I tried to omit the radicle. Other authors using a millimeter caliper have not omitted it. I clarify that both program, after analysis, generate Microsoft Office Excel files with the results of the measurements.
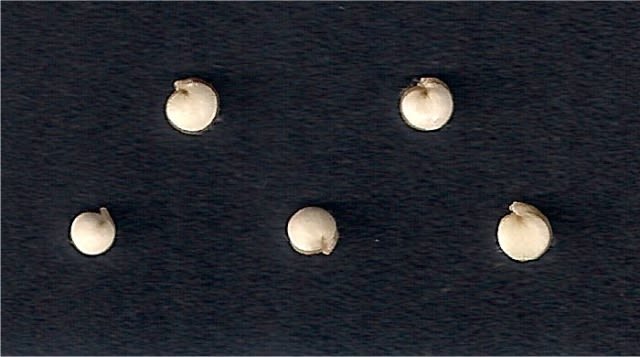
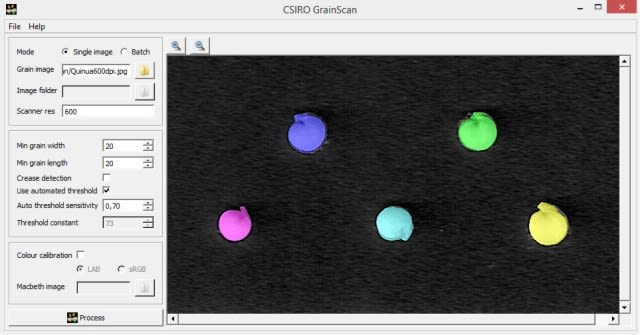
The image generated by the scanner was as follows.
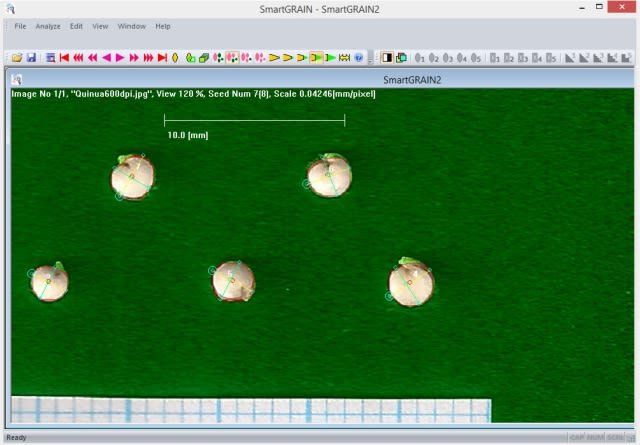
The created image by SmartGrain is as follows.
Next, the generated image in the GrainScan software.

And finally, the image obtained with PHOTO-PAINT using the procedure described above (largo = length; ancho = width).
Statistical analysis
I performed a general analysis of variance on the measured values of the seeds in order to establish differences between the seeds of the subsample (G1, G2, G3, G4 and G5) and also between the programs (SmartGrain, GrainScan and PHOTO-PAINT ). Due to the precision in the measurements with PHOTO-PAINT that does not require repetition of the values, I added +0.01 and -0.01 mm to each data to obtain more values and I did the same with the SmartGrain and GrainScan data. I also made a comparison of means with Tukey’s honest significant difference test. The software I used was Statistix for Windows, version 10.
Physical characteristics of quinoa seeds
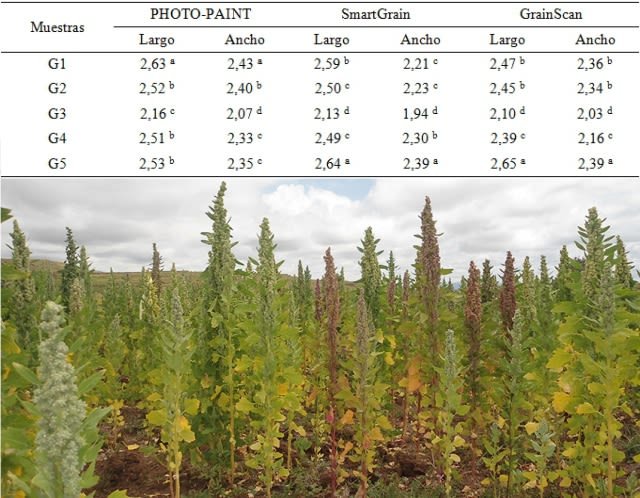
The values obtained in the measurements of the seeds are presented below in a table. Among the seeds of the subsample, there were statistically significant differences (p < 0.05) in the length and width variables. The homogeneous groups or without statistical differences (p > 0.05) in the measurements were: in PHOTO-PAINT, G4 and G5 for length and width; in SmartGrain, G2 and G4 for length and G1 and G2 for width; in GrainScan, G1 and G2 for length and width. With PHOTO-PAINT the longest and widest seed was G1, while SmartGrain and GrainScan recognized it was G5. This was due to the fact that with PHOTO-PAINT the measurements were carried out only vertically and horizontally (the largest dimension, or the smallest, may be excluded due to the position of the seed), and not in other possible ways (diagonal) as in the case of SmartGrain and GrainScan. The length of G1, G2 and G3 was greater and the width shorter with SmartGrain when compared to the GrainScan program. This variation was due to the degree of precision in the assignment of values in GrainScan to carry out the segmentation of the images with the aim of excluding the radicle; decreasing the area reduced the length and not all of the radicle managed to be excluded. There was a coincidence, that the least long and wide seed was G3.
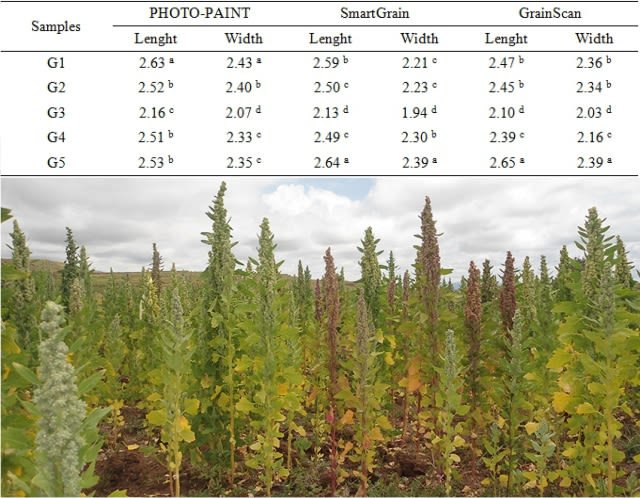
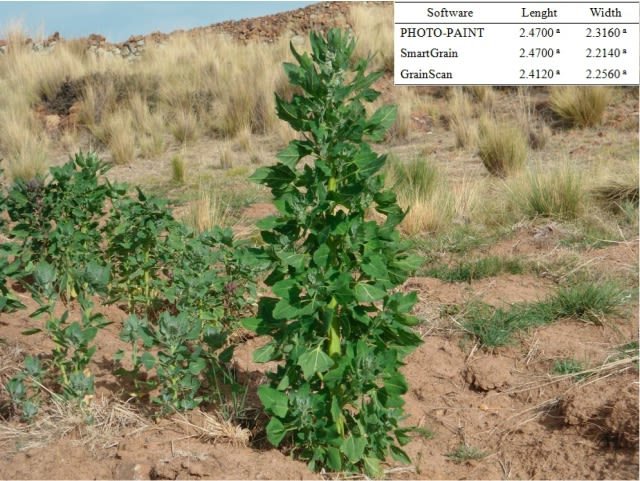
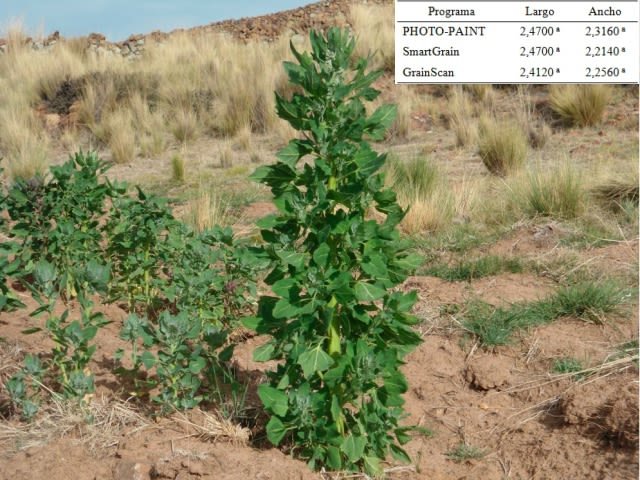
In relation to the averages of the dimensions differentiated by software, I show the following table. When analyzing all the measures of the length and width variables by software, there were no statistically significant differences (p > 0.05) between the programs. That is, despite the variations in the values, the measurement for both variables statistically was not different. The three programs, under the established criteria and parameters, they offered the same result in relation to the average value of the length and width of the five seeds.
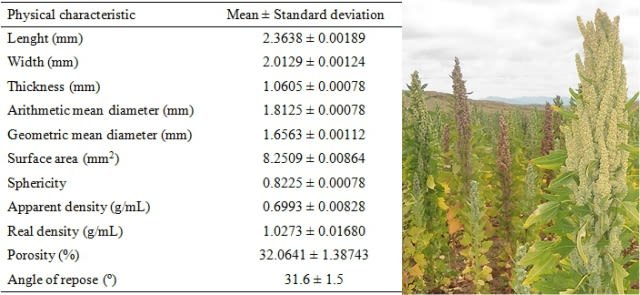
When there are values for length, width and thickness of seeds, various calculations can be performed using established equations, which will allow a range of physical characteristics of the same. The calculations that are generally carried out are: the arithmetic and geometric mean diameter, surface area, sphericity, apparent and real density, porosity and angle of repose. In this work those values were determined and I present them in the following table. The equations can be consulted if desired by clicking here.
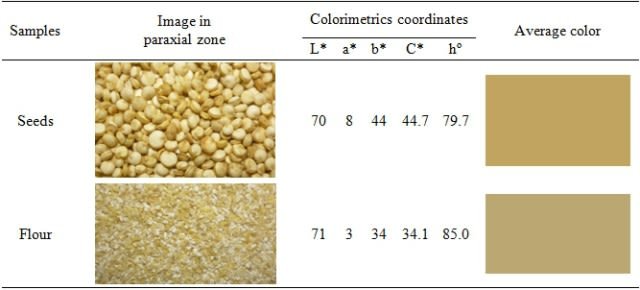
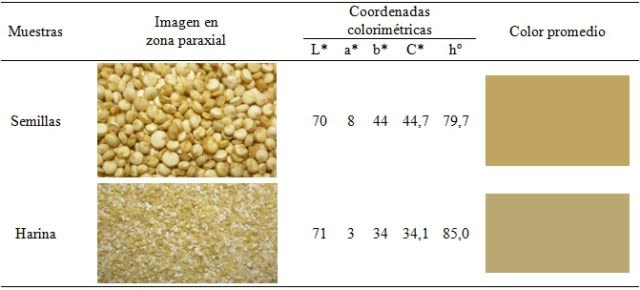
Finally, I commented above that the reality of creating the stage was to photograph a portion of whole seeds and another portion of quinoa flour (partially ground seeds) to later determine another physical characteristic, color in colorimetric coordinates (rectangular and polar). The results are presented in the following table.

SmartGrain software is free and can be downloaded with the manual (here). It is recommended to consult the paper of the authors of the software published in the journal Plant Physiology (here).
GrainScan software is also free and can be downloaded (here). It is recommended to consult the paper of the authors of the software published in the journal Plant Methods (here).
The work described, all the images and tables are of my authorship and Peruvian colleague. Links to sources are found in the text.

Procesamiento digital de imágenes para determinar características físicas de semillas de quinua
Las características físicas de los granos y/o semillas son necesarias conocerlas, de manera fundamentalmente importante, cuando se va a diseñar y desarrollar maquinarias y procesos con miras a un desarrollo productivo. Las características físicas influenciarán los parámetros de trabajo de los equipos o maquinarias a diseñar, y además a la construcción de estructuras o instalaciones que involucran los pasos operacionales de recolección o cosecha, el sistema de transporte, la separación, el secado y la aireación de las semillas hasta su almacenamiento y procesamiento. Además de la importancia mencionada, también se suma que son parámetros que revisten interés en el análisis de la calidad de las semillas, la aplicación de la normativa existente en los mercados y fundamentales para el diseño de empaques.
Entre las características físicas de las semillas, algunas son el tamaño, el volumen, la forma, la densidad y la porosidad, y en la determinación de características físicas algunas dependen o se originan de las dimensiones ortogonales, es decir, el largo, el ancho y el espesor.
Por otro lado, el valor nutricional de las semillas de la quinua (Chenopodium quinoa Willd.) es ampliamente conocido. Si desea leer una revisión completa en español puede pulsar clic aquí. Menciono a la quinua porque una característica muy particular de la semilla es su pequeño tamaño. En estas semillas no es factible realizar medidas precisas de dimensiones ortogonales empleando un calibrador tipo Vernier. A manera de ejemplo para dar una idea del tamaño, en la siguiente imagen comparo semillas con un escalímetro.

Con el propósito de medir semillas de quinua, un colega de Perú se me acercó con la idea de realizar mediciones en esas semillas usando fotografías de ellas en papel milimetrado y el programa PHOTO-PAINT versión 11 de Corel; haciendo uso a su vez de los píxeles en las imágenes. Luego de comunicaciones en línea decidimos determinar inicialmente dimensiones ortogonales mediante procesamiento digital de imágenes utilizando varios programas para después calcular características físicas de las semillas.
Muestras
Utilizamos 2 muestras de semillas. Una fue de semillas de quinua procesada o beneficiada provenientes del Distrito de Cabana, Provincia de San Román, Departamento de Puno (Perú) y la otra consistió en semillas de quinua procesada o beneficiada (“perlada”) importada de Perú; que adquirí en un establecimiento comercial en Valencia, Estado Carabobo (Venezuela). Aclaro que mi colega trabajó en Perú y yo en Venezuela.
Programas y equipos
Los programas empleados fueron PHOTO-PAINT versiones 11 (en Perú) y X5 (en Venezuela), Photoshop versión CS6, Paint versión 6.3, SmartGrain versión 1.2 y GrainScan versión 1.0 (en Venezuela). Las cámaras digitales empleadas fueron Panasonic (LUMIX) modelos DMC-FP3 (en Perú), utilizada por defecto excepto en la calibración del tamaño de imagen a alta resolución, y DMC-FS42 (en Venezuela), calibrada usando un procedimiento que usé con antelación en otra investigación. El programa GrainScan requiere de un escáner y usé el HP Deskjet F2280 con el software HP Photosmart Essential versión 2.5, calibrado a resolución de 600 ppp (puntos por pulgada). Computadoras con procesadores Intel® Celeron® 2,00 GHz (RAM 351 MB) en Perú, e Intel® CoreTM i3-3130M 2,60 GHz (RAM 4 GB) en Venezuela.
Preparación de las muestras y captura de las imágenes
Para la muestra de Perú, 30 semillas de quinua se colocaron sobre papel milimetrado (distancia de observación a criterio), se capturaron imágenes con la cámara digital DMC-FP3 y se guardaron como archivos con extensión .jpg.
Para la muestra de Venezuela, monté un escenario con un portalámpara usando como fuente de luz un reflector marca General Electric simulador de la luz del día (D65) y la cámara digital DMC-FS42 la ubiqué en un soporte. La geometría de las direcciones de iluminación/observación fue de 45º/0º, la distancia del ángulo de iluminación 15 cm y la distancia del ángulo de observación a criterio. En este escenario solo coloqué 1 semilla de quinua (rotulada como G0) sobre papel milimetrado con el propósito de medir en las imágenes captadas (archivos con extensión .jpg) las dimensiones ortogonales en los programas PHOTO-PAINT, Photoshop y Paint, con el propósito de escoger 1 entre los 3 programas para realizar otras mediciones en semillas de quinua. Aclaro que no son necesarios tantos detalles creando un escenario para tal fin; la realidad de crear el escenario fue para fotografiar una porción de semillas enteras y otra de harina de quinua (semillas parcialmente molidas) para posteriormente determinarles el color en coordenadas colorimétricas (rectangulares y polares) acorde a un procedimiento que elaboré en otra investigación, tomando en cuenta que tenía los equipos necesarios calibrados.
Utilicé una submuestra de 5 semillas rotuladas como G1, G2, G3, G4 y G5 colocadas en una misma posición para los ensayos con SmartGrain y GrainScan. Para la captación de imágenes con escáner (en el caso de GrainScan), las mismas 5 semillas las fijé con silicón líquido como adhesivo y en la misma posición sobre una lámina de material plástico de color negro mate (hay que voltear la lámina para escanear); lámina que también utilicé fotografiar y obtener imagen para SmartGrain. Las guardé como archivos con extensión .jpg.
Procesamiento de las imágenes digitales
La imagen con extensión .jpg de la semilla rotulada como G0 la abrí en PHOTO-PAINT y aumenté el nivel de zum hasta poder apreciar los píxeles. En el menú ‘Ver’, seleccioné en ‘Información sobre la imagen’, y esto permite apreciar una ventana acoplable que aporta información sobre las coordenadas x (anchura) e y (altura). En la ventana seleccioné como unidad de medida a píxeles y luego con la herramienta ‘Rectángulo’, dibujé uno (en color azul) arrastrando el cursor con el propósito de medir el equivalente de 1 mm del papel milimetrado en píxeles; en la siguiente imagen detalle se observa que la altura y anchura fue de 75 píxeles, es decir, una equivalencia de 1 mm = 75 píxeles.
Con la herramienta ‘Máscara rectángulo’, la cual define áreas editables, realicé la medición de la altura y anchura de la semilla en la imagen.
El mismo resultado se obtiene dibujando un rectángulo vertical y otro horizontal con la herramienta ‘Rectángulo’.

Para apreciar los píxeles de la imagen anterior, muestro la siguiente que corresponde a donde se cruzan la línea rectángulo azul con la roja; cada cuadrado es 1 píxel.

Ahora, para el espesor del grano, el procedimiento es el mismo.

Del procedimiento usando PHOTO-PAINT se deriva que en la imagen la altura (largo) fue 161 píxeles, la anchura (ancho) 155 píxeles y la altura (espesor) 84 píxeles. Luego en base a la equivalencia (1 mm = 75 píxeles), las dimensiones de la semilla fueron: largo 2,1467 mm; ancho 2,0667 mm; y espesor 1,1200 mm.
Similar procedimiento con el mismo archivo de la semilla (G0) lo realicé con los programas Photoshop y Paint para comparación y comprobación.

En Photoshop.
Así se ven los píxeles en Photoshop donde se cruzan la línea rectángulo azul con la roja; cada cuadrado es 1 píxel.

En Paint.
En conclusión, con los 3 programas se obtiene la misma expresión del resultado de una medición; no obstante, opté por usar PHOTO-PAINT para las siguientes mediciones cuyo objetivo era comparar con SmartGrain y GrainScan (pude utilizar Photoshop o Paint).
En el caso de la submuestra de 5 semillas (G1, G2, G3, G4 y G5) con los programas SmartGrain y GrainScan, medí el largo y ancho de las mismas. Ambos programas requieren previos ensayos para remover áreas que no son de interés, lo que se conoce como segmentación de imágenes, antes del análisis morfológico final. En SmartGrain establecí una intensidad de precisión en la detección de semillas por defecto (2 de 4) y en el umbral para la eliminación de aristas una intensidad de detección “nogi” 4 (de 5); de manera adicional, la falsa detección la corregí usando la opción tecla “shift” sostenida. En GrainScan, para disminuir cierta área detectada falsamente identificada establecí un umbral de sensibilidad automático de 0,70. En todas las mediciones que efectué, procuré no tomar en cuenta la radícula. Otros autores usando calibrador milimétrico si la han tomado en cuenta. Aclaro que ambos programas luego del análisis, generan archivos de Microsoft Office Excel con los resultados de las mediciones.
La imagen generada por el escáner fue la siguiente.

La creada por SmartGrain es la que sigue.

A continuación la que se generó en el programa GrainScan.
Y finalmente, la obtenida con PHOTO-PAINT mediante el procedimiento descrito anteriormente.

Análisis estadísticos
A los valores medidos de las semillas les realicé un análisis de varianza general con el propósito de establecer diferencias entre las semillas de la submuestra (G1, G2, G3, G4 y G5) y además entre los programas (SmartGrain, GrainScan y PHOTO-PAINT). En razón de la precisión en las mediciones con PHOTO-PAINT que no amerita repetición a los valores, agregué +0,01 y -0,01 mm a cada dato para obtener más valores y lo mismo hice con los datos de SmartGrain y GrainScan. Realicé además una comparación de medias con la prueba de diferencia significativa honesta de Tukey. El software que usé fue el Statistix for Windows, versión 10.
Características físicas de las semillas de quinua
Los valores obtenidos en las mediciones de las semillas los presento a continuación en un cuadro. Entre las semillas de la submuestra, hubo diferencias estadísticas significativas (p < 0,05) en las variables largo y ancho. Los grupos homogéneos o sin diferencias estadísticas (p > 0,05) en las medidas fueron: en PHOTO-PAINT, G4 y G5 para largo y ancho; en SmartGrain, G2 y G4 para largo y G1 y G2 para ancho; en GrainScan, G1 y G2 para largo y ancho. Con PHOTO-PAINT la semilla más larga y ancha fue G1, mientras que SmartGrain y GrainScan reconocieron fue a G5. Esto se debió a que con PHOTO-PAINT las medidas se efectuaron solo de manera vertical y horizontal (pudiendo quedar excluida la mayor dimensión, o la menor, por la posición del grano), y no de otras formas posibles (diagonal) como ocurre con SmartGrain y GrainScan. El largo de G1, G2 y G3 fue mayor y el ancho menor con SmartGrain al comparar con el programa GrainScan. Esta variación fue debida al grado de precisión en la asignación de valores en GrainScan para llevar a cabo la segmentación de las imágenes con la pretensión de excluir la radícula; la disminución del área redujo el largo y no toda la radícula logró excluirse. Hubo coincidencia en que la semilla menos larga y ancha fue G3.
En relación con los promedios de las dimensiones diferenciados por programa muestro el siguiente cuadro. Al analizar todas las medidas de las variables largo y ancho por programa, no hubo diferencias estadísticas significativas (p > 0,05) entre los programas. Es decir, a pesar de las variaciones en los valores, la medición para ambas variables estadísticamente no fue diferente. Los 3 programas, bajo los criterios y parámetros fijados ofrecieron un mismo resultado con relación al valor promedio del largo y el ancho de las 5 semillas.
Cuando se tienen valores de largo, ancho y espesor de semillas se pueden realizar diversos cálculos mediante ecuaciones establecidas, lo que permitirá una amplitud de caracteres físicos de las mismas. Los cálculos que por lo general se realizan son: el diámetro medio aritmético y geométrico, área superficial, esfericidad, densidad aparente y real, porosidad y ángulo de reposo. En este trabajo fueron determinados esos valores y los presento en el siguiente cuadro. Sobre las ecuaciones, pueden consultarse si se desea pulsando clic aquí.

Finalmente, arriba comenté que la realidad de crear el escenario fue para fotografiar una porción de semillas enteras y otra de harina de quinua (semillas parcialmente molidas) para posteriormente determinarles otra característica física, el color en coordenadas colorimétricas (rectangulares y polares). Los resultados los presento en el cuadro siguiente.

El software SmartGrain es gratuito y puede descargarse con el manual (aquí). Es recomendable consultar el trabajo de los autores del software publicado en la revista Plant Physiology (aquí).
El software GrainScan también es gratuito y puede descargarse (aquí). Es recomendable consultar el trabajo de los autores del software publicado en la revista Plant Methods (aquí).
El trabajo descrito, todas las imágenes y cuadros son de mi autoría y mi colega peruano. En el texto se encuentran enlaces a las fuentes.

0
0
0.000
Congratulations @capp! You have completed the following achievement on the Hive blockchain and have been rewarded with new badge(s) :
You can view your badges on your board and compare to others on the Ranking
If you no longer want to receive notifications, reply to this comment with the word
STOPDo not miss the last post from @hivebuzz:
Vote for us as a witness to get one more badge and upvotes from us with more power!
Saludos @hivebuzz. Es grato tenerlos de vuelta.
Hola hola! Aqui @lizanomadsoul del equipo HiveBuzz 🙂
Muchas gracias @capp! Estamos felices de estar devuelta también! Se siente rico 😉
Saludos y un abrazo ❤️
Thanks for your contribution to the STEMsocial community. Feel free to join us on discord to get to know the rest of us!
Please consider supporting our funding proposal, approving our witness (@stem.witness) or delegating to the @steemstem account (for some ROI).
Thanks for using the STEMsocial app, which gives you stronger support. Including @steemstem as a beneficiary could yield even more support next time.
Agradecido por el apoyo.
@capp, thank you for supporting the HiveBuzz project by voting for @steemitboard as a witness.
Click on the badge to view your Board of Honor.
Once again, thanks for your support!
Do not miss the last post from @hivebuzz:
El equipo @hivebuzz es merecedor de apoyo.
🙏🙏Muchas gracias por tu apoyo @capp, también es muy apreciado.