NEOXAG Weekly Tokenomics

After talking with @neoxian I decided to do a weekly post related with NEOXAG tokenomics.
Why weekly and not daily?
Because I think a daily post about this, it will be like spam.
NEOXAG
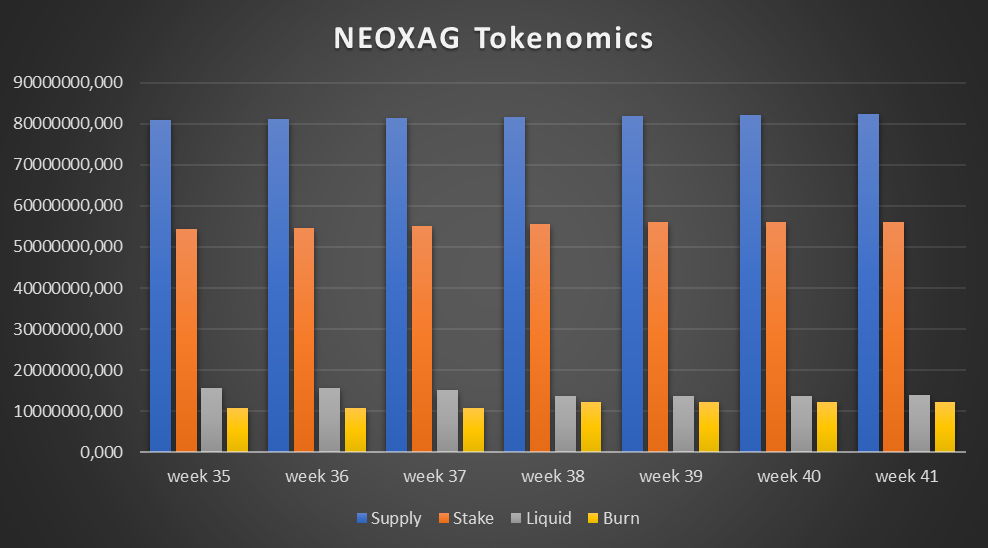
| Supply | Stake | Liquid | Burn | Holders | |
|---|---|---|---|---|---|
| week 35 | 80860408.380 | 54291011.723 | 15677044.285 | 10892375.038 | 26412 |
| week 36 | 81093865.046 | 54664269.512 | 15537099.004 | 10892496.530 | 26496 |
| week 37 | 81345141.713 | 55201796.872 | 15249783.87 | 10893560.970 | 26571 |
| week 38 | 81610883.713 | 55665384.361 | 13655294.637 | 12290204.715 | 26652 |
| week 39 | 81850653.046 | 55974319.655 | 13585577.076 | 12290756.316 | 26688 |
| week 40 | 82116893.713 | 56037899.343 | 13787391.153 | 12291603.217 | 26686 |
| week 41 | 82367365.713 | 56096781.662 | 13978202.020 | 12292382.031 | 26755 |
Comparing with the previous week, we have 250472 increase in supply, 58882.32 more NEOXAG staked, more 190810.8673 NEOXAG liquid, more 778.8132912 NEOXAG burned and new 69 holders.
| Inflation | |
|---|---|
| week 36 | 0.29% |
| week 37 | 0.31% |
| week 38 | 0.33% |
| week 39 | 0.29% |
| week 40 | 0.33% |
| week 41 | 0.31% |
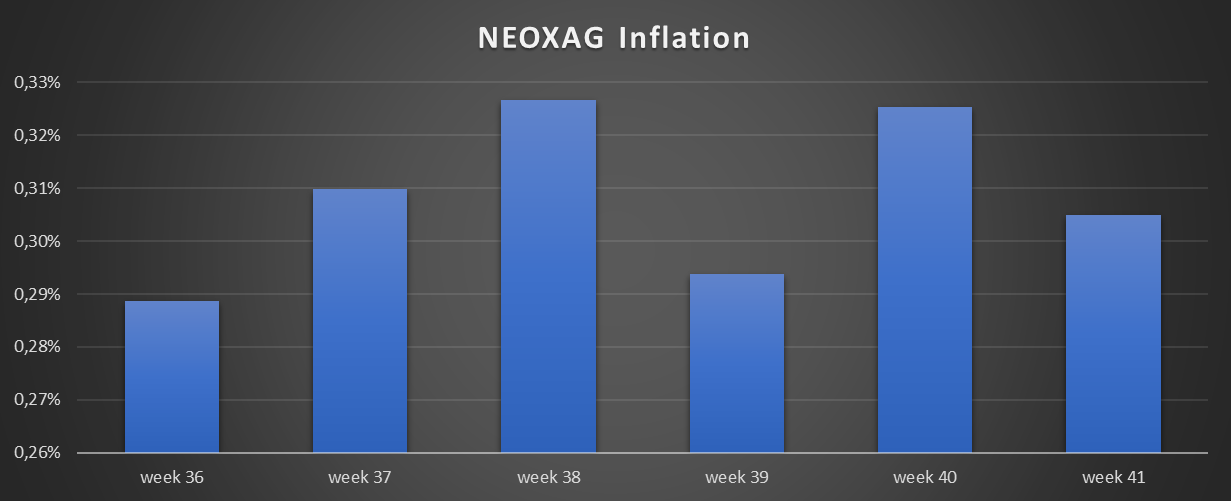
NEOXAG current average inflation is 0.31%
| Supply | Stake | Liquid | Burn | Holders | |
|---|---|---|---|---|---|
| week 36 | 0.29% | 0.69% | -0.89% | 0.001% | 0.32% |
| week 37 | 0.31% | 0.98% | -29.89% | 0.01% | 0.28% |
| week 38 | 0.33% | 0.84% | 25.35% | 12.821% | 0.30% |
| week 39 | 0.29% | 0.55% | -0.51% | 0% | 0.14% |
| week 40 | 0.33% | 0.11% | 1.49% | 0.01% | -0.01% |
| week 41 | 0.31% | 0.11% | 1.38% | 0.01% | 0.26% |
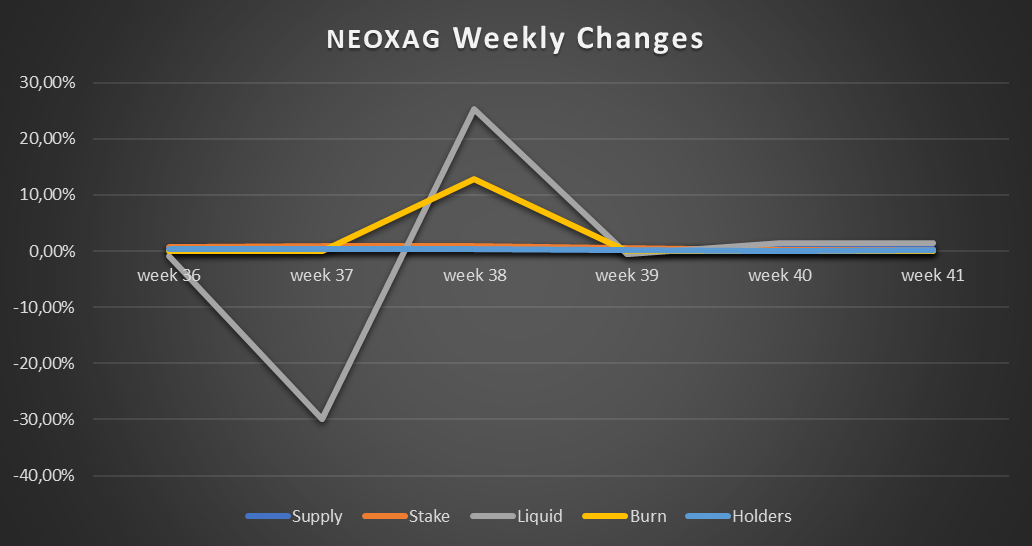
This means our supply increased 0.31%, the NEOXAG staked increased 0.11%, the liquid NEOXAG increased 1.38%, NEOXAG burned increased 0.01% and holders increased 0.26%.
Posted using Neoxian City
0
0
0.000
Any ideas on what causes such a high burn and what does get burned?
I really dont know What causes that high burn.
Not a significant improvement, but the progress is commendable.
Yes it is